using Plots
Plots.default(linewidth=2)Fig 4.22
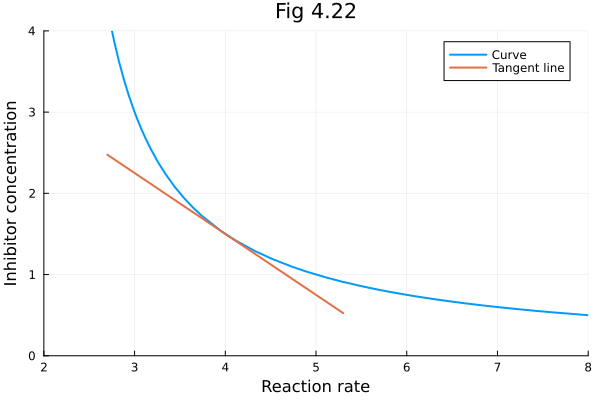
Tangent line.
The curve
f = x -> 3 / (x-2)#2 (generic function with 1 method)fig = plot(title="Fig 4.22")
plot!(fig, f, 2.2, 8.0, lab="Curve")
plot!(fig, x -> -3 / (4 - 2)^2 * (x - 4) + f(4), 2.7, 5.3, lab="Tangent line")
plot!(fig, xlabel="Reaction rate", ylabel="Inhibitor concentration",
xlims=(2., 8.), ylims=(0., 4.)
)
This notebook was generated using Literate.jl.
Back to top