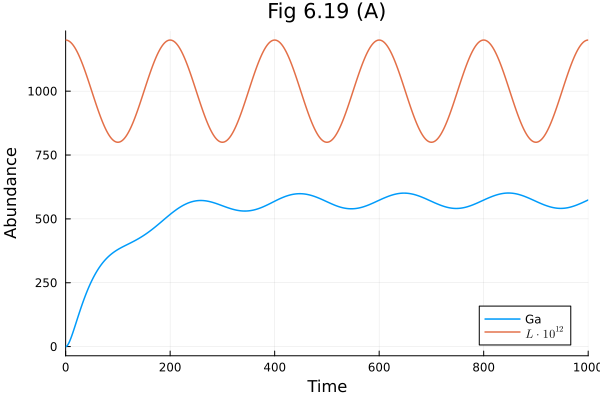
Sine wave response of g-protein signalling pathway
using OrdinaryDiffEq
using Catalyst
using Plots
using LaTeXStrings

@time "Build system" rn605 = @reaction_network begin
    @parameters lt l_AMP l_per
    @equations begin
        L ~ lt + (lt / l_AMP) * cospi(2t / l_per)
    end
    kRL * L, R --> RL
    kRLm, RL --> R
    kGa, RL + G --> RL + Ga + Gbg
    kGd0, Ga --> Gd
    kG1, Gd + Gbg --> G
end
Build system: 0.421357 seconds (542.95 k allocations: 59.422 MiB, 13.62% gc time, 84.80% compilation time: 57% of which was recompilation)
Loading...
alg = FBDF()
up619 = Dict(
    :kRL => 2e6,
    :kRLm => 0.01,
    :kGa => 1e-5,
    :kGd0 => 0.11,
    :kG1 => 1.0,
    :R => 4e3,
    :G => 1e4,
    :lt => 1e-9,
    :l_per => 200.0,
    :l_AMP => 5.0,
    :RL => 0.0,
    :Ga => 0.0,
    :Gd => 0.0,
    :Gbg => 0.0
)

tend = 1000.0
@time "Build problem" prob619 = ODEProblem(rn605, up619, (0.0, tend); mtkcompile=true)
@time "Solve problem" sol619 = solve(prob619, alg)

@unpack Ga, L = rn605
plot(sol619, idxs=[Ga, L*1E12], title="Fig 6.19 (A)", xlabel="Time", ylabel="Abundance", label=["Ga" L"L \cdot 10^{12}"])
Build problem: 1.364217 seconds (2.15 M allocations: 124.469 MiB, 98.06% compilation time)
Solve problem: 1.099521 seconds (1.36 M allocations: 75.418 MiB, 99.52% compilation time)
This notebook was generated using Literate.jl.