Using pandas#
import pandas as pd
import numpy as np # for generating random numbers
Series#
# series
s1 = pd.Series([10, 11, 12], dtype = float)
s1
0    10.0
1    11.0
2    12.0
dtype: float64
s2 = pd.Series([10, 11, 12], dtype = int)
s2
0    10
1    11
2    12
dtype: int64
s3 = pd.Series(["10", "11", "12"], name = 'Val', index = pd.Index(['a', 'b', 'c'], name = 'label'))
s3
label
a    10
b    11
c    12
Name: Val, dtype: object
s1.index
RangeIndex(start=0, stop=3, step=1)
# s1.append(s2)
s4 = pd.concat([s1, s3])
s4
0    10.0
1    11.0
2    12.0
a      10
b      11
c      12
dtype: object
print(s4[0])
print(s4)
s4_reset = s4.reset_index(drop=True)
print(s4_reset)
s4_reset[0]
10.0
0    10.0
1    11.0
2    12.0
a      10
b      11
c      12
dtype: object
0    10.0
1    11.0
2    12.0
3      10
4      11
5      12
dtype: object
10.0
dates = pd.date_range('20190503', periods=7)

dates
DatetimeIndex(['2019-05-03', '2019-05-04', '2019-05-05', '2019-05-06',
               '2019-05-07', '2019-05-08', '2019-05-09'],
              dtype='datetime64[ns]', freq='D')
DataFrame#
df = pd.DataFrame(np.random.randn(7, 4), index=dates, columns=list('ABCD'))
df
| A | B | C | D | |
|---|---|---|---|---|
| 2019-05-03 | 0.465284 | 0.538804 | -0.084648 | 0.824585 |
| 2019-05-04 | 1.056398 | -1.202514 | -0.523837 | 0.402067 |
| 2019-05-05 | -0.852327 | 1.295320 | 1.564651 | 0.514154 |
| 2019-05-06 | 0.673734 | 0.156297 | 0.276160 | 0.170253 |
| 2019-05-07 | -1.893253 | -0.071872 | 0.427727 | 0.292936 |
| 2019-05-08 | -0.282505 | -0.344844 | -0.718255 | 1.326604 |
| 2019-05-09 | -0.207327 | 1.032207 | -0.721679 | 0.386969 |
df2 = pd.DataFrame({'A': 1.,
                    'B': pd.Timestamp('20130102'),
                    'C': pd.Series(1, index=list(range(2, 6)), dtype='float32'),
                    'D': np.array([3] * 4, dtype='int32'),
                    'E': pd.Categorical(["test", "train", "test", "train"]),
                    'F': 'foo'})
df2
| A | B | C | D | E | F | |
|---|---|---|---|---|---|---|
| 2 | 1.0 | 2013-01-02 | 1.0 | 3 | test | foo |
| 3 | 1.0 | 2013-01-02 | 1.0 | 3 | train | foo |
| 4 | 1.0 | 2013-01-02 | 1.0 | 3 | test | foo |
| 5 | 1.0 | 2013-01-02 | 1.0 | 3 | train | foo |
df2.dtypes
A          float64
B    datetime64[s]
C          float32
D            int32
E         category
F           object
dtype: object
df = pd.read_csv('heart.csv')
df
| Unnamed: 0 | Age | Sex | ChestPain | RestBP | Chol | Fbs | RestECG | MaxHR | ExAng | Oldpeak | Slope | Ca | Thal | AHD | |
|---|---|---|---|---|---|---|---|---|---|---|---|---|---|---|---|
| 0 | 1 | 63 | 1 | typical | 145 | 233 | 1 | 2 | 150 | 0 | 2.3 | 3 | 0.0 | fixed | No |
| 1 | 2 | 67 | 1 | asymptomatic | 160 | 286 | 0 | 2 | 108 | 1 | 1.5 | 2 | 3.0 | normal | Yes |
| 2 | 3 | 67 | 1 | asymptomatic | 120 | 229 | 0 | 2 | 129 | 1 | 2.6 | 2 | 2.0 | reversable | Yes |
| 3 | 4 | 37 | 1 | nonanginal | 130 | 250 | 0 | 0 | 187 | 0 | 3.5 | 3 | 0.0 | normal | No |
| 4 | 5 | 41 | 0 | nontypical | 130 | 204 | 0 | 2 | 172 | 0 | 1.4 | 1 | 0.0 | normal | No |
| ... | ... | ... | ... | ... | ... | ... | ... | ... | ... | ... | ... | ... | ... | ... | ... |
| 298 | 299 | 45 | 1 | typical | 110 | 264 | 0 | 0 | 132 | 0 | 1.2 | 2 | 0.0 | reversable | Yes |
| 299 | 300 | 68 | 1 | asymptomatic | 144 | 193 | 1 | 0 | 141 | 0 | 3.4 | 2 | 2.0 | reversable | Yes |
| 300 | 301 | 57 | 1 | asymptomatic | 130 | 131 | 0 | 0 | 115 | 1 | 1.2 | 2 | 1.0 | reversable | Yes |
| 301 | 302 | 57 | 0 | nontypical | 130 | 236 | 0 | 2 | 174 | 0 | 0.0 | 2 | 1.0 | normal | Yes |
| 302 | 303 | 38 | 1 | nonanginal | 138 | 175 | 0 | 0 | 173 | 0 | 0.0 | 1 | NaN | normal | No |
303 rows × 15 columns
Viewing Data#
df.head(10)
| Unnamed: 0 | Age | Sex | ChestPain | RestBP | Chol | Fbs | RestECG | MaxHR | ExAng | Oldpeak | Slope | Ca | Thal | AHD | |
|---|---|---|---|---|---|---|---|---|---|---|---|---|---|---|---|
| 0 | 1 | 63 | 1 | typical | 145 | 233 | 1 | 2 | 150 | 0 | 2.3 | 3 | 0.0 | fixed | No |
| 1 | 2 | 67 | 1 | asymptomatic | 160 | 286 | 0 | 2 | 108 | 1 | 1.5 | 2 | 3.0 | normal | Yes |
| 2 | 3 | 67 | 1 | asymptomatic | 120 | 229 | 0 | 2 | 129 | 1 | 2.6 | 2 | 2.0 | reversable | Yes |
| 3 | 4 | 37 | 1 | nonanginal | 130 | 250 | 0 | 0 | 187 | 0 | 3.5 | 3 | 0.0 | normal | No |
| 4 | 5 | 41 | 0 | nontypical | 130 | 204 | 0 | 2 | 172 | 0 | 1.4 | 1 | 0.0 | normal | No |
| 5 | 6 | 56 | 1 | nontypical | 120 | 236 | 0 | 0 | 178 | 0 | 0.8 | 1 | 0.0 | normal | No |
| 6 | 7 | 62 | 0 | asymptomatic | 140 | 268 | 0 | 2 | 160 | 0 | 3.6 | 3 | 2.0 | normal | Yes |
| 7 | 8 | 57 | 0 | asymptomatic | 120 | 354 | 0 | 0 | 163 | 1 | 0.6 | 1 | 0.0 | normal | No |
| 8 | 9 | 63 | 1 | asymptomatic | 130 | 254 | 0 | 2 | 147 | 0 | 1.4 | 2 | 1.0 | reversable | Yes |
| 9 | 10 | 53 | 1 | asymptomatic | 140 | 203 | 1 | 2 | 155 | 1 | 3.1 | 3 | 0.0 | reversable | Yes |
df.tail(8)
| Unnamed: 0 | Age | Sex | ChestPain | RestBP | Chol | Fbs | RestECG | MaxHR | ExAng | Oldpeak | Slope | Ca | Thal | AHD | |
|---|---|---|---|---|---|---|---|---|---|---|---|---|---|---|---|
| 295 | 296 | 41 | 1 | nontypical | 120 | 157 | 0 | 0 | 182 | 0 | 0.0 | 1 | 0.0 | normal | No |
| 296 | 297 | 59 | 1 | asymptomatic | 164 | 176 | 1 | 2 | 90 | 0 | 1.0 | 2 | 2.0 | fixed | Yes |
| 297 | 298 | 57 | 0 | asymptomatic | 140 | 241 | 0 | 0 | 123 | 1 | 0.2 | 2 | 0.0 | reversable | Yes |
| 298 | 299 | 45 | 1 | typical | 110 | 264 | 0 | 0 | 132 | 0 | 1.2 | 2 | 0.0 | reversable | Yes |
| 299 | 300 | 68 | 1 | asymptomatic | 144 | 193 | 1 | 0 | 141 | 0 | 3.4 | 2 | 2.0 | reversable | Yes |
| 300 | 301 | 57 | 1 | asymptomatic | 130 | 131 | 0 | 0 | 115 | 1 | 1.2 | 2 | 1.0 | reversable | Yes |
| 301 | 302 | 57 | 0 | nontypical | 130 | 236 | 0 | 2 | 174 | 0 | 0.0 | 2 | 1.0 | normal | Yes |
| 302 | 303 | 38 | 1 | nonanginal | 138 | 175 | 0 | 0 | 173 | 0 | 0.0 | 1 | NaN | normal | No |
df.describe()
| Unnamed: 0 | Age | Sex | RestBP | Chol | Fbs | RestECG | MaxHR | ExAng | Oldpeak | Slope | Ca | |
|---|---|---|---|---|---|---|---|---|---|---|---|---|
| count | 303.000000 | 303.000000 | 303.000000 | 303.000000 | 303.000000 | 303.000000 | 303.000000 | 303.000000 | 303.000000 | 303.000000 | 303.000000 | 299.000000 |
| mean | 152.000000 | 54.438944 | 0.679868 | 131.689769 | 246.693069 | 0.148515 | 0.990099 | 149.607261 | 0.326733 | 1.039604 | 1.600660 | 0.672241 |
| std | 87.612784 | 9.038662 | 0.467299 | 17.599748 | 51.776918 | 0.356198 | 0.994971 | 22.875003 | 0.469794 | 1.161075 | 0.616226 | 0.937438 |
| min | 1.000000 | 29.000000 | 0.000000 | 94.000000 | 126.000000 | 0.000000 | 0.000000 | 71.000000 | 0.000000 | 0.000000 | 1.000000 | 0.000000 |
| 25% | 76.500000 | 48.000000 | 0.000000 | 120.000000 | 211.000000 | 0.000000 | 0.000000 | 133.500000 | 0.000000 | 0.000000 | 1.000000 | 0.000000 |
| 50% | 152.000000 | 56.000000 | 1.000000 | 130.000000 | 241.000000 | 0.000000 | 1.000000 | 153.000000 | 0.000000 | 0.800000 | 2.000000 | 0.000000 |
| 75% | 227.500000 | 61.000000 | 1.000000 | 140.000000 | 275.000000 | 0.000000 | 2.000000 | 166.000000 | 1.000000 | 1.600000 | 2.000000 | 1.000000 |
| max | 303.000000 | 77.000000 | 1.000000 | 200.000000 | 564.000000 | 1.000000 | 2.000000 | 202.000000 | 1.000000 | 6.200000 | 3.000000 | 3.000000 |
df.index
RangeIndex(start=0, stop=303, step=1)
df.columns
Index(['Unnamed: 0', 'Age', 'Sex', 'ChestPain', 'RestBP', 'Chol', 'Fbs',
       'RestECG', 'MaxHR', 'ExAng', 'Oldpeak', 'Slope', 'Ca', 'Thal', 'AHD'],
      dtype='object')
# df.sort_index(axis=0, ascending=True)
# df.sort_index(axis=0, ascending=False)

df.sort_index(axis=1, ascending=True)
df.sort_index(axis=1, ascending=False)
| Unnamed: 0 | Thal | Slope | Sex | RestECG | RestBP | Oldpeak | MaxHR | Fbs | ExAng | Chol | ChestPain | Ca | Age | AHD | |
|---|---|---|---|---|---|---|---|---|---|---|---|---|---|---|---|
| 0 | 1 | fixed | 3 | 1 | 2 | 145 | 2.3 | 150 | 1 | 0 | 233 | typical | 0.0 | 63 | No |
| 1 | 2 | normal | 2 | 1 | 2 | 160 | 1.5 | 108 | 0 | 1 | 286 | asymptomatic | 3.0 | 67 | Yes |
| 2 | 3 | reversable | 2 | 1 | 2 | 120 | 2.6 | 129 | 0 | 1 | 229 | asymptomatic | 2.0 | 67 | Yes |
| 3 | 4 | normal | 3 | 1 | 0 | 130 | 3.5 | 187 | 0 | 0 | 250 | nonanginal | 0.0 | 37 | No |
| 4 | 5 | normal | 1 | 0 | 2 | 130 | 1.4 | 172 | 0 | 0 | 204 | nontypical | 0.0 | 41 | No |
| ... | ... | ... | ... | ... | ... | ... | ... | ... | ... | ... | ... | ... | ... | ... | ... |
| 298 | 299 | reversable | 2 | 1 | 0 | 110 | 1.2 | 132 | 0 | 0 | 264 | typical | 0.0 | 45 | Yes |
| 299 | 300 | reversable | 2 | 1 | 0 | 144 | 3.4 | 141 | 1 | 0 | 193 | asymptomatic | 2.0 | 68 | Yes |
| 300 | 301 | reversable | 2 | 1 | 0 | 130 | 1.2 | 115 | 0 | 1 | 131 | asymptomatic | 1.0 | 57 | Yes |
| 301 | 302 | normal | 2 | 0 | 2 | 130 | 0.0 | 174 | 0 | 0 | 236 | nontypical | 1.0 | 57 | Yes |
| 302 | 303 | normal | 1 | 1 | 0 | 138 | 0.0 | 173 | 0 | 0 | 175 | nonanginal | NaN | 38 | No |
303 rows × 15 columns
df.sort_values(by = 'Sex', ascending = False)
| Unnamed: 0 | Age | Sex | ChestPain | RestBP | Chol | Fbs | RestECG | MaxHR | ExAng | Oldpeak | Slope | Ca | Thal | AHD | |
|---|---|---|---|---|---|---|---|---|---|---|---|---|---|---|---|
| 15 | 16 | 57 | 1 | nonanginal | 150 | 168 | 0 | 0 | 174 | 0 | 1.6 | 1 | 0.0 | normal | No |
| 302 | 303 | 38 | 1 | nonanginal | 138 | 175 | 0 | 0 | 173 | 0 | 0.0 | 1 | NaN | normal | No |
| 0 | 1 | 63 | 1 | typical | 145 | 233 | 1 | 2 | 150 | 0 | 2.3 | 3 | 0.0 | fixed | No |
| 1 | 2 | 67 | 1 | asymptomatic | 160 | 286 | 0 | 2 | 108 | 1 | 1.5 | 2 | 3.0 | normal | Yes |
| 2 | 3 | 67 | 1 | asymptomatic | 120 | 229 | 0 | 2 | 129 | 1 | 2.6 | 2 | 2.0 | reversable | Yes |
| ... | ... | ... | ... | ... | ... | ... | ... | ... | ... | ... | ... | ... | ... | ... | ... |
| 291 | 292 | 55 | 0 | nontypical | 132 | 342 | 0 | 0 | 166 | 0 | 1.2 | 1 | 0.0 | normal | No |
| 18 | 19 | 48 | 0 | nonanginal | 130 | 275 | 0 | 0 | 139 | 0 | 0.2 | 1 | 0.0 | normal | No |
| 7 | 8 | 57 | 0 | asymptomatic | 120 | 354 | 0 | 0 | 163 | 1 | 0.6 | 1 | 0.0 | normal | No |
| 6 | 7 | 62 | 0 | asymptomatic | 140 | 268 | 0 | 2 | 160 | 0 | 3.6 | 3 | 2.0 | normal | Yes |
| 4 | 5 | 41 | 0 | nontypical | 130 | 204 | 0 | 2 | 172 | 0 | 1.4 | 1 | 0.0 | normal | No |
303 rows × 15 columns
df.T
| 0 | 1 | 2 | 3 | 4 | 5 | 6 | 7 | 8 | 9 | ... | 293 | 294 | 295 | 296 | 297 | 298 | 299 | 300 | 301 | 302 | |
|---|---|---|---|---|---|---|---|---|---|---|---|---|---|---|---|---|---|---|---|---|---|
| Unnamed: 0 | 1 | 2 | 3 | 4 | 5 | 6 | 7 | 8 | 9 | 10 | ... | 294 | 295 | 296 | 297 | 298 | 299 | 300 | 301 | 302 | 303 |
| Age | 63 | 67 | 67 | 37 | 41 | 56 | 62 | 57 | 63 | 53 | ... | 63 | 63 | 41 | 59 | 57 | 45 | 68 | 57 | 57 | 38 |
| Sex | 1 | 1 | 1 | 1 | 0 | 1 | 0 | 0 | 1 | 1 | ... | 1 | 0 | 1 | 1 | 0 | 1 | 1 | 1 | 0 | 1 |
| ChestPain | typical | asymptomatic | asymptomatic | nonanginal | nontypical | nontypical | asymptomatic | asymptomatic | asymptomatic | asymptomatic | ... | asymptomatic | asymptomatic | nontypical | asymptomatic | asymptomatic | typical | asymptomatic | asymptomatic | nontypical | nonanginal |
| RestBP | 145 | 160 | 120 | 130 | 130 | 120 | 140 | 120 | 130 | 140 | ... | 140 | 124 | 120 | 164 | 140 | 110 | 144 | 130 | 130 | 138 |
| Chol | 233 | 286 | 229 | 250 | 204 | 236 | 268 | 354 | 254 | 203 | ... | 187 | 197 | 157 | 176 | 241 | 264 | 193 | 131 | 236 | 175 |
| Fbs | 1 | 0 | 0 | 0 | 0 | 0 | 0 | 0 | 0 | 1 | ... | 0 | 0 | 0 | 1 | 0 | 0 | 1 | 0 | 0 | 0 |
| RestECG | 2 | 2 | 2 | 0 | 2 | 0 | 2 | 0 | 2 | 2 | ... | 2 | 0 | 0 | 2 | 0 | 0 | 0 | 0 | 2 | 0 |
| MaxHR | 150 | 108 | 129 | 187 | 172 | 178 | 160 | 163 | 147 | 155 | ... | 144 | 136 | 182 | 90 | 123 | 132 | 141 | 115 | 174 | 173 |
| ExAng | 0 | 1 | 1 | 0 | 0 | 0 | 0 | 1 | 0 | 1 | ... | 1 | 1 | 0 | 0 | 1 | 0 | 0 | 1 | 0 | 0 |
| Oldpeak | 2.3 | 1.5 | 2.6 | 3.5 | 1.4 | 0.8 | 3.6 | 0.6 | 1.4 | 3.1 | ... | 4.0 | 0.0 | 0.0 | 1.0 | 0.2 | 1.2 | 3.4 | 1.2 | 0.0 | 0.0 |
| Slope | 3 | 2 | 2 | 3 | 1 | 1 | 3 | 1 | 2 | 3 | ... | 1 | 2 | 1 | 2 | 2 | 2 | 2 | 2 | 2 | 1 |
| Ca | 0.0 | 3.0 | 2.0 | 0.0 | 0.0 | 0.0 | 2.0 | 0.0 | 1.0 | 0.0 | ... | 2.0 | 0.0 | 0.0 | 2.0 | 0.0 | 0.0 | 2.0 | 1.0 | 1.0 | NaN |
| Thal | fixed | normal | reversable | normal | normal | normal | normal | normal | reversable | reversable | ... | reversable | normal | normal | fixed | reversable | reversable | reversable | reversable | normal | normal |
| AHD | No | Yes | Yes | No | No | No | Yes | No | Yes | Yes | ... | Yes | Yes | No | Yes | Yes | Yes | Yes | Yes | Yes | No |
15 rows × 303 columns
df['Age']
0      63
1      67
2      67
3      37
4      41
       ..
298    45
299    68
300    57
301    57
302    38
Name: Age, Length: 303, dtype: int64
df[['Age', 'Sex']]
| Age | Sex | |
|---|---|---|
| 0 | 63 | 1 |
| 1 | 67 | 1 |
| 2 | 67 | 1 |
| 3 | 37 | 1 |
| 4 | 41 | 0 |
| ... | ... | ... |
| 298 | 45 | 1 |
| 299 | 68 | 1 |
| 300 | 57 | 1 |
| 301 | 57 | 0 |
| 302 | 38 | 1 |
303 rows × 2 columns
df[['Age', 'Sex']][0:2]
| Age | Sex | |
|---|---|---|
| 0 | 63 | 1 |
| 1 | 67 | 1 |
df[0:2][['Age']]
| Age | |
|---|---|
| 0 | 63 |
| 1 | 67 |
Data Selection#
df.loc[4]
# df
Unnamed: 0             5
Age                   41
Sex                    0
ChestPain     nontypical
RestBP               130
Chol                 204
Fbs                    0
RestECG                2
MaxHR                172
ExAng                  0
Oldpeak              1.4
Slope                  1
Ca                   0.0
Thal              normal
AHD                   No
Name: 4, dtype: object
df.loc[[3,5], ['Age', 'Fbs']]
| Age | Fbs | |
|---|---|---|
| 3 | 37 | 0 |
| 5 | 56 | 0 |
df.iloc[5]
Unnamed: 0             6
Age                   56
Sex                    1
ChestPain     nontypical
RestBP               120
Chol                 236
Fbs                    0
RestECG                0
MaxHR                178
ExAng                  0
Oldpeak              0.8
Slope                  1
Ca                   0.0
Thal              normal
AHD                   No
Name: 5, dtype: object
df.iloc[5, 3]
'nontypical'
# df.iloc[5:7, 3:7]
# df.iloc[[5, 7, 9], 3:7]
# df.iloc[:, 3]
df.iloc[3: 5, :]
# df.loc[5:7, 3:7]
| Unnamed: 0 | Age | Sex | ChestPain | RestBP | Chol | Fbs | RestECG | MaxHR | ExAng | Oldpeak | Slope | Ca | Thal | AHD | |
|---|---|---|---|---|---|---|---|---|---|---|---|---|---|---|---|
| 3 | 4 | 37 | 1 | nonanginal | 130 | 250 | 0 | 0 | 187 | 0 | 3.5 | 3 | 0.0 | normal | No |
| 4 | 5 | 41 | 0 | nontypical | 130 | 204 | 0 | 2 | 172 | 0 | 1.4 | 1 | 0.0 | normal | No |
df.iloc[1, 1]
df.at[1, 'Age'] # Get scalar values. It's a very fast loc
df.iat[1, 1] # Get scalar values. It's a very fast iloc
np.int64(67)
df['Age'] > 50
0       True
1       True
2       True
3      False
4      False
       ...
298    False
299     True
300     True
301     True
302    False
Name: Age, Length: 303, dtype: bool
df[df.Age > 50]
| Unnamed: 0 | Age | Sex | ChestPain | RestBP | Chol | Fbs | RestECG | MaxHR | ExAng | Oldpeak | Slope | Ca | Thal | AHD | |
|---|---|---|---|---|---|---|---|---|---|---|---|---|---|---|---|
| 0 | 1 | 63 | 1 | typical | 145 | 233 | 1 | 2 | 150 | 0 | 2.3 | 3 | 0.0 | fixed | No |
| 1 | 2 | 67 | 1 | asymptomatic | 160 | 286 | 0 | 2 | 108 | 1 | 1.5 | 2 | 3.0 | normal | Yes |
| 2 | 3 | 67 | 1 | asymptomatic | 120 | 229 | 0 | 2 | 129 | 1 | 2.6 | 2 | 2.0 | reversable | Yes |
| 5 | 6 | 56 | 1 | nontypical | 120 | 236 | 0 | 0 | 178 | 0 | 0.8 | 1 | 0.0 | normal | No |
| 6 | 7 | 62 | 0 | asymptomatic | 140 | 268 | 0 | 2 | 160 | 0 | 3.6 | 3 | 2.0 | normal | Yes |
| ... | ... | ... | ... | ... | ... | ... | ... | ... | ... | ... | ... | ... | ... | ... | ... |
| 296 | 297 | 59 | 1 | asymptomatic | 164 | 176 | 1 | 2 | 90 | 0 | 1.0 | 2 | 2.0 | fixed | Yes |
| 297 | 298 | 57 | 0 | asymptomatic | 140 | 241 | 0 | 0 | 123 | 1 | 0.2 | 2 | 0.0 | reversable | Yes |
| 299 | 300 | 68 | 1 | asymptomatic | 144 | 193 | 1 | 0 | 141 | 0 | 3.4 | 2 | 2.0 | reversable | Yes |
| 300 | 301 | 57 | 1 | asymptomatic | 130 | 131 | 0 | 0 | 115 | 1 | 1.2 | 2 | 1.0 | reversable | Yes |
| 301 | 302 | 57 | 0 | nontypical | 130 | 236 | 0 | 2 | 174 | 0 | 0.0 | 2 | 1.0 | normal | Yes |
209 rows × 15 columns
df2 = df.copy()
df2 = df2.iloc[0: 5, :]
df2
| Unnamed: 0 | Age | Sex | ChestPain | RestBP | Chol | Fbs | RestECG | MaxHR | ExAng | Oldpeak | Slope | Ca | Thal | AHD | |
|---|---|---|---|---|---|---|---|---|---|---|---|---|---|---|---|
| 0 | 1 | 63 | 1 | typical | 145 | 233 | 1 | 2 | 150 | 0 | 2.3 | 3 | 0.0 | fixed | No |
| 1 | 2 | 67 | 1 | asymptomatic | 160 | 286 | 0 | 2 | 108 | 1 | 1.5 | 2 | 3.0 | normal | Yes |
| 2 | 3 | 67 | 1 | asymptomatic | 120 | 229 | 0 | 2 | 129 | 1 | 2.6 | 2 | 2.0 | reversable | Yes |
| 3 | 4 | 37 | 1 | nonanginal | 130 | 250 | 0 | 0 | 187 | 0 | 3.5 | 3 | 0.0 | normal | No |
| 4 | 5 | 41 | 0 | nontypical | 130 | 204 | 0 | 2 | 172 | 0 | 1.4 | 1 | 0.0 | normal | No |
# dfa['A'] = list(range(len(dfa.index)))  # use this form to create a new column
df2['cp'] = ['three', 'two', 'one', 'one', 'zero']
df2
df2.cp.isin(['one', 'zero'])
0    False
1    False
2     True
3     True
4     True
Name: cp, dtype: bool
df2[df2.cp.isin(['one', 'zero'])]
| Unnamed: 0 | Age | Sex | ChestPain | RestBP | Chol | Fbs | RestECG | MaxHR | ExAng | Oldpeak | Slope | Ca | Thal | AHD | cp | |
|---|---|---|---|---|---|---|---|---|---|---|---|---|---|---|---|---|
| 2 | 3 | 67 | 1 | asymptomatic | 120 | 229 | 0 | 2 | 129 | 1 | 2.6 | 2 | 2.0 | reversable | Yes | one |
| 3 | 4 | 37 | 1 | nonanginal | 130 | 250 | 0 | 0 | 187 | 0 | 3.5 | 3 | 0.0 | normal | No | one |
| 4 | 5 | 41 | 0 | nontypical | 130 | 204 | 0 | 2 | 172 | 0 | 1.4 | 1 | 0.0 | normal | No | zero |
Missing Data#
df1 = df.reindex(index=range(0, 4), columns=list(df.columns) + ['E'])
df1.loc[2:3, 'E'] = 1
df1
| Unnamed: 0 | Age | Sex | ChestPain | RestBP | Chol | Fbs | RestECG | MaxHR | ExAng | Oldpeak | Slope | Ca | Thal | AHD | E | |
|---|---|---|---|---|---|---|---|---|---|---|---|---|---|---|---|---|
| 0 | 1 | 63 | 1 | typical | 145 | 233 | 1 | 2 | 150 | 0 | 2.3 | 3 | 0.0 | fixed | No | NaN |
| 1 | 2 | 67 | 1 | asymptomatic | 160 | 286 | 0 | 2 | 108 | 1 | 1.5 | 2 | 3.0 | normal | Yes | NaN |
| 2 | 3 | 67 | 1 | asymptomatic | 120 | 229 | 0 | 2 | 129 | 1 | 2.6 | 2 | 2.0 | reversable | Yes | 1.0 |
| 3 | 4 | 37 | 1 | nonanginal | 130 | 250 | 0 | 0 | 187 | 0 | 3.5 | 3 | 0.0 | normal | No | 1.0 |
df1.dropna(how='any')
| Unnamed: 0 | Age | Sex | ChestPain | RestBP | Chol | Fbs | RestECG | MaxHR | ExAng | Oldpeak | Slope | Ca | Thal | AHD | E | |
|---|---|---|---|---|---|---|---|---|---|---|---|---|---|---|---|---|
| 2 | 3 | 67 | 1 | asymptomatic | 120 | 229 | 0 | 2 | 129 | 1 | 2.6 | 2 | 2.0 | reversable | Yes | 1.0 |
| 3 | 4 | 37 | 1 | nonanginal | 130 | 250 | 0 | 0 | 187 | 0 | 3.5 | 3 | 0.0 | normal | No | 1.0 |
pd.isna(df1)
| Unnamed: 0 | Age | Sex | ChestPain | RestBP | Chol | Fbs | RestECG | MaxHR | ExAng | Oldpeak | Slope | Ca | Thal | AHD | E | |
|---|---|---|---|---|---|---|---|---|---|---|---|---|---|---|---|---|
| 0 | False | False | False | False | False | False | False | False | False | False | False | False | False | False | False | True |
| 1 | False | False | False | False | False | False | False | False | False | False | False | False | False | False | False | True |
| 2 | False | False | False | False | False | False | False | False | False | False | False | False | False | False | False | False |
| 3 | False | False | False | False | False | False | False | False | False | False | False | False | False | False | False | False |
df1.fillna(value=2)
| Unnamed: 0 | Age | Sex | ChestPain | RestBP | Chol | Fbs | RestECG | MaxHR | ExAng | Oldpeak | Slope | Ca | Thal | AHD | E | |
|---|---|---|---|---|---|---|---|---|---|---|---|---|---|---|---|---|
| 0 | 1 | 63 | 1 | typical | 145 | 233 | 1 | 2 | 150 | 0 | 2.3 | 3 | 0.0 | fixed | No | 2.0 |
| 1 | 2 | 67 | 1 | asymptomatic | 160 | 286 | 0 | 2 | 108 | 1 | 1.5 | 2 | 3.0 | normal | Yes | 2.0 |
| 2 | 3 | 67 | 1 | asymptomatic | 120 | 229 | 0 | 2 | 129 | 1 | 2.6 | 2 | 2.0 | reversable | Yes | 1.0 |
| 3 | 4 | 37 | 1 | nonanginal | 130 | 250 | 0 | 0 | 187 | 0 | 3.5 | 3 | 0.0 | normal | No | 1.0 |
Operations#
df1.mean(numeric_only=True)
Unnamed: 0      2.500
Age            58.500
Sex             1.000
RestBP        138.750
Chol          249.500
Fbs             0.250
RestECG         1.500
MaxHR         143.500
ExAng           0.500
Oldpeak         2.475
Slope           2.500
Ca              1.250
E               1.000
dtype: float64
df1.mean(axis = 1, numeric_only=True)
0    50.108333
1    52.791667
2    43.046154
3    47.423077
dtype: float64
# df1.sub([10 for _ in range(4)], axis = 'index')
df1.mul([10 for _ in range(4)], axis = 'index')
| Unnamed: 0 | Age | Sex | ChestPain | RestBP | Chol | Fbs | RestECG | MaxHR | ExAng | Oldpeak | Slope | Ca | Thal | AHD | E | |
|---|---|---|---|---|---|---|---|---|---|---|---|---|---|---|---|---|
| 0 | 10 | 630 | 10 | typicaltypicaltypicaltypicaltypicaltypicaltypi... | 1450 | 2330 | 10 | 20 | 1500 | 0 | 23.0 | 30 | 0.0 | fixedfixedfixedfixedfixedfixedfixedfixedfixedf... | NoNoNoNoNoNoNoNoNoNo | NaN |
| 1 | 20 | 670 | 10 | asymptomaticasymptomaticasymptomaticasymptomat... | 1600 | 2860 | 0 | 20 | 1080 | 10 | 15.0 | 20 | 30.0 | normalnormalnormalnormalnormalnormalnormalnorm... | YesYesYesYesYesYesYesYesYesYes | NaN |
| 2 | 30 | 670 | 10 | asymptomaticasymptomaticasymptomaticasymptomat... | 1200 | 2290 | 0 | 20 | 1290 | 10 | 26.0 | 20 | 20.0 | reversablereversablereversablereversablerevers... | YesYesYesYesYesYesYesYesYesYes | 10.0 |
| 3 | 40 | 370 | 10 | nonanginalnonanginalnonanginalnonanginalnonang... | 1300 | 2500 | 0 | 0 | 1870 | 0 | 35.0 | 30 | 0.0 | normalnormalnormalnormalnormalnormalnormalnorm... | NoNoNoNoNoNoNoNoNoNo | 10.0 |
df1
| Unnamed: 0 | Age | Sex | ChestPain | RestBP | Chol | Fbs | RestECG | MaxHR | ExAng | Oldpeak | Slope | Ca | Thal | AHD | E | |
|---|---|---|---|---|---|---|---|---|---|---|---|---|---|---|---|---|
| 0 | 1 | 63 | 1 | typical | 145 | 233 | 1 | 2 | 150 | 0 | 2.3 | 3 | 0.0 | fixed | No | NaN |
| 1 | 2 | 67 | 1 | asymptomatic | 160 | 286 | 0 | 2 | 108 | 1 | 1.5 | 2 | 3.0 | normal | Yes | NaN |
| 2 | 3 | 67 | 1 | asymptomatic | 120 | 229 | 0 | 2 | 129 | 1 | 2.6 | 2 | 2.0 | reversable | Yes | 1.0 |
| 3 | 4 | 37 | 1 | nonanginal | 130 | 250 | 0 | 0 | 187 | 0 | 3.5 | 3 | 0.0 | normal | No | 1.0 |
df1.apply(np.cumsum)
| Unnamed: 0 | Age | Sex | ChestPain | RestBP | Chol | Fbs | RestECG | MaxHR | ExAng | Oldpeak | Slope | Ca | Thal | AHD | E | |
|---|---|---|---|---|---|---|---|---|---|---|---|---|---|---|---|---|
| 0 | 1 | 63 | 1 | typical | 145 | 233 | 1 | 2 | 150 | 0 | 2.3 | 3 | 0.0 | fixed | No | NaN |
| 1 | 3 | 130 | 2 | typicalasymptomatic | 305 | 519 | 1 | 4 | 258 | 1 | 3.8 | 5 | 3.0 | fixednormal | NoYes | NaN |
| 2 | 6 | 197 | 3 | typicalasymptomaticasymptomatic | 425 | 748 | 1 | 6 | 387 | 2 | 6.4 | 7 | 5.0 | fixednormalreversable | NoYesYes | 1.0 |
| 3 | 10 | 234 | 4 | typicalasymptomaticasymptomaticnonanginal | 555 | 998 | 1 | 6 | 574 | 2 | 9.9 | 10 | 5.0 | fixednormalreversablenormal | NoYesYesNo | 2.0 |
df1.Age.apply(lambda x: x*365.25)
0    23010.75
1    24471.75
2    24471.75
3    13514.25
Name: Age, dtype: float64
s = pd.Series(np.random.randint(0, 7, size=10))
s
0    1
1    5
2    0
3    0
4    3
5    2
6    3
7    6
8    1
9    4
dtype: int64
s.value_counts()
1    2
0    2
3    2
5    1
2    1
6    1
4    1
Name: count, dtype: int64
s = pd.Series(['A', 'B', 'C', 'Aaba', 'Baca', np.nan, 'CABA', 'dog', 'cat'])
s
0       A
1       B
2       C
3    Aaba
4    Baca
5     NaN
6    CABA
7     dog
8     cat
dtype: object
s.str.lower()
0       a
1       b
2       c
3    aaba
4    baca
5     NaN
6    caba
7     dog
8     cat
dtype: object
Merge#
df2 = pd.DataFrame(np.random.randn(10, 4))
pieces = [df2[:3], df2[3:7], df2[7:]]
pieces
[          0         1         2         3
 0  0.692410 -2.284672 -1.151157  0.013098
 1  0.231878 -0.223465 -0.189316 -0.349842
 2  0.351452  0.323439 -0.701539  1.055823,
           0         1         2         3
 3 -0.877684 -0.274598  1.024527  1.303178
 4  0.017126  0.978138  0.243010  0.857772
 5  0.130374  0.988586 -0.574495 -0.409112
 6  0.900823 -0.419795 -1.366464  0.879580,
           0         1         2         3
 7 -0.601936 -0.499010 -0.634395 -0.292615
 8  0.814405 -0.875706 -0.423207  0.575195
 9  0.304728  0.178558 -0.050064 -1.864102]
pd.concat([pieces[2], pieces[1], pieces[0]])
| 0 | 1 | 2 | 3 | |
|---|---|---|---|---|
| 7 | -0.601936 | -0.499010 | -0.634395 | -0.292615 |
| 8 | 0.814405 | -0.875706 | -0.423207 | 0.575195 |
| 9 | 0.304728 | 0.178558 | -0.050064 | -1.864102 |
| 3 | -0.877684 | -0.274598 | 1.024527 | 1.303178 |
| 4 | 0.017126 | 0.978138 | 0.243010 | 0.857772 |
| 5 | 0.130374 | 0.988586 | -0.574495 | -0.409112 |
| 6 | 0.900823 | -0.419795 | -1.366464 | 0.879580 |
| 0 | 0.692410 | -2.284672 | -1.151157 | 0.013098 |
| 1 | 0.231878 | -0.223465 | -0.189316 | -0.349842 |
| 2 | 0.351452 | 0.323439 | -0.701539 | 1.055823 |
left = pd.DataFrame({'key': ['foo', 'foo'], 'lval': [1, 2]})
right = pd.DataFrame({'key': ['foo', 'foo'], 'rval': [4, 5]})

left
| key | lval | |
|---|---|---|
| 0 | foo | 1 |
| 1 | foo | 2 |
right
| key | rval | |
|---|---|---|
| 0 | foo | 4 |
| 1 | foo | 5 |
pd.merge(left, right, on='key')
| key | lval | rval | |
|---|---|---|---|
| 0 | foo | 1 | 4 |
| 1 | foo | 1 | 5 |
| 2 | foo | 2 | 4 |
| 3 | foo | 2 | 5 |
left = pd.DataFrame({'key': ['foo', 'bar'], 'lval': [1, 2]})
right = pd.DataFrame({'key': ['foo', 'bar'], 'rval': [4, 5]})
pd.merge(left, right, on='key')
| key | lval | rval | |
|---|---|---|---|
| 0 | foo | 1 | 4 |
| 1 | bar | 2 | 5 |
left
| key | lval | |
|---|---|---|
| 0 | foo | 1 |
| 1 | bar | 2 |
right
| key | rval | |
|---|---|---|
| 0 | foo | 4 |
| 1 | bar | 5 |
df = pd.DataFrame(np.random.randn(8, 4), columns=['A', 'B', 'C', 'D'])
df
| A | B | C | D | |
|---|---|---|---|---|
| 0 | -2.551439 | 0.385764 | 0.647788 | 0.674905 |
| 1 | 0.152723 | -0.864426 | 0.055485 | 0.360788 |
| 2 | -0.207967 | -0.622615 | 0.855046 | 0.538077 |
| 3 | 0.838218 | 2.159128 | 0.110032 | -0.382456 |
| 4 | -0.869810 | -0.444058 | -0.250610 | -1.724799 |
| 5 | -1.322664 | 1.823062 | 0.204350 | 0.839900 |
| 6 | -0.373768 | -0.354830 | 0.349522 | -0.302326 |
| 7 | 0.159168 | 0.460504 | 0.188865 | 0.122157 |
Grouping#
df = pd.DataFrame({'A': ['foo', 'bar', 'foo', 'bar',
                    'foo', 'bar', 'foo', 'foo'],
                    'B': ['one', 'one', 'two', 'three',
                    'two', 'two', 'one', 'three'],
                    'C': np.random.randn(8),
                    'D': np.random.randn(8)})

df
| A | B | C | D | |
|---|---|---|---|---|
| 0 | foo | one | 0.442162 | -0.346094 |
| 1 | bar | one | 1.990105 | 0.278912 |
| 2 | foo | two | 0.555404 | -1.356027 |
| 3 | bar | three | 1.295348 | 1.449866 |
| 4 | foo | two | 0.898158 | -0.054815 |
| 5 | bar | two | 1.013803 | -0.761748 |
| 6 | foo | one | 0.784650 | 0.842388 |
| 7 | foo | three | 1.148353 | -0.191844 |
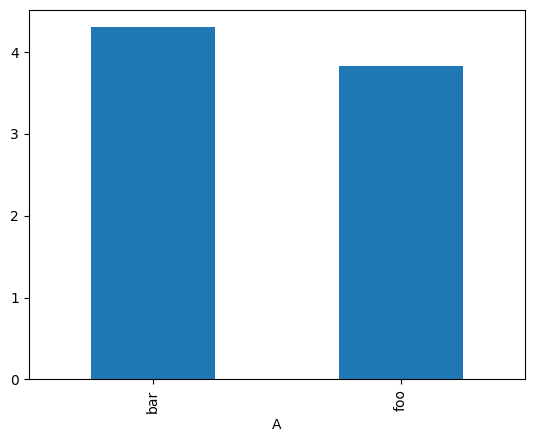
df.groupby('A').sum()
| B | C | D | |
|---|---|---|---|
| A | |||
| bar | onethreetwo | 4.299256 | 0.967030 |
| foo | onetwotwoonethree | 3.828727 | -1.106392 |
df.groupby(['A', 'B']).sum()
| C | D | ||
|---|---|---|---|
| A | B | ||
| bar | one | 1.990105 | 0.278912 |
| three | 1.295348 | 1.449866 | |
| two | 1.013803 | -0.761748 | |
| foo | one | 1.226812 | 0.496294 |
| three | 1.148353 | -0.191844 | |
| two | 1.453562 | -1.410843 |
Plotting#
df.groupby('A').sum()['C'].plot(kind='bar')
<Axes: xlabel='A'>
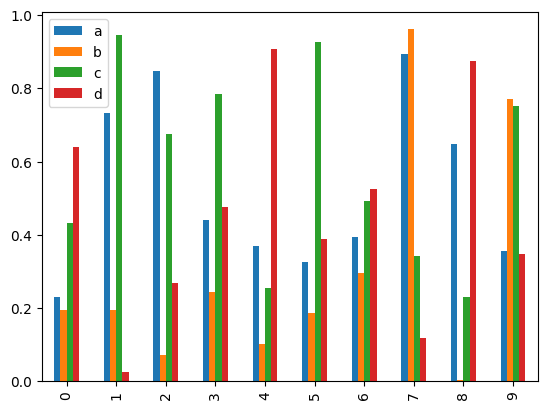
df2 = pd.DataFrame(np.random.rand(10, 4), columns=['a', 'b', 'c', 'd'])
df2.plot.bar()
<Axes: >
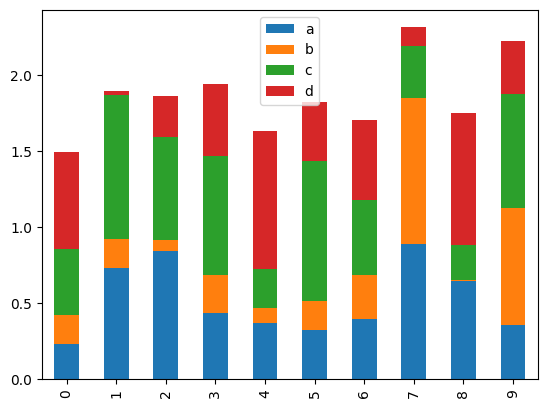
df2.plot.bar(stacked=True);
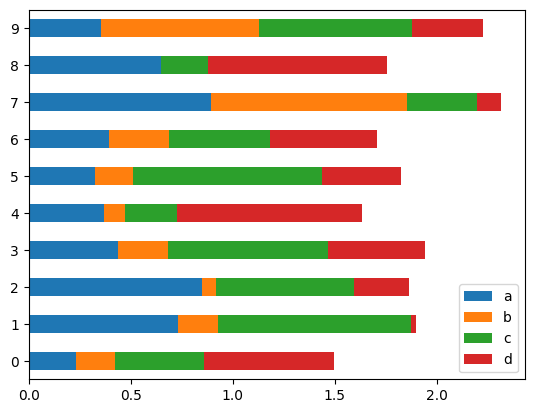
df2.plot.barh(stacked=True)
<Axes: >
File I/O#
df = pd.read_csv('heart.csv')
df.head()
| Unnamed: 0 | Age | Sex | ChestPain | RestBP | Chol | Fbs | RestECG | MaxHR | ExAng | Oldpeak | Slope | Ca | Thal | AHD | |
|---|---|---|---|---|---|---|---|---|---|---|---|---|---|---|---|
| 0 | 1 | 63 | 1 | typical | 145 | 233 | 1 | 2 | 150 | 0 | 2.3 | 3 | 0.0 | fixed | No |
| 1 | 2 | 67 | 1 | asymptomatic | 160 | 286 | 0 | 2 | 108 | 1 | 1.5 | 2 | 3.0 | normal | Yes |
| 2 | 3 | 67 | 1 | asymptomatic | 120 | 229 | 0 | 2 | 129 | 1 | 2.6 | 2 | 2.0 | reversable | Yes |
| 3 | 4 | 37 | 1 | nonanginal | 130 | 250 | 0 | 0 | 187 | 0 | 3.5 | 3 | 0.0 | normal | No |
| 4 | 5 | 41 | 0 | nontypical | 130 | 204 | 0 | 2 | 172 | 0 | 1.4 | 1 | 0.0 | normal | No |
# df.to_csv('heart_copy.csv', index = False)
# df1 = df[:10]
# df2 = df[10:20]
# df3 = df[20:40]
# with pd.ExcelWriter('path_to_file.xlsx') as writer:
#     df1.to_excel(writer, sheet_name='Sheet1', index = False)
#     df2.to_excel(writer, sheet_name='Sheet2', index = False)
#     df3.to_excel(writer, sheet_name='Sheet3')