using OrdinaryDiffEq
using ModelingToolkit
using Plots
using ECMEDox
using ECMEDox: second, mM, Hz, μM, build_stim_callbacks
Plots.default(lw=1.5, size=(600, 600))Doxorubicin addition test
tend = 1000.0second
bcl = 1second
@named sys = build_model()
sts = unknowns(sys)
u0 = build_u0(sys)
@unpack iStim = sys
callback = build_stim_callbacks(iStim, tend; period=bcl)
opts = (; reltol=1e-6, abstol=1e-6, callback=callback, saveat=0.1second)
prob = ODEProblem(sys, u0, tend)
ODEProblem with uType Vector{Float64} and tType Float64. In-place: true Initialization status: FULLY_DETERMINED Non-trivial mass matrix: false timespan: (0.0, 1.0e6) u0: 64-element Vector{Float64}: 2.196435053752864 0.0007273589705197244 0.000981691808598968 245.22202099807583 281.0719264404058 197.06621753790645 34.41477140951692 60.37913837798986 229.2919970960533 22.321405235243013 ⋮ 23.148552252520883 0.6928662120941113 0.20648605639609985 1295.5364065086924 1299.7940884726063 0.20381438659933854 145551.11317854663 10276.480036234318 -85.29107641956527
The collapse of MMP is between 290uM and 300uM of DOX
@unpack DOX = sys
doxrange = 290μM:1μM:300μM
prob_func = (prob, i, repeat) -> begin
    prob.ps[DOX] = doxrange[i]
    prob
end
#2 (generic function with 1 method)eprob = EnsembleProblem(prob; prob_func)
@time sim = solve(eprob, KenCarp47(); trajectories=length(doxrange), opts...)340.716259 seconds (160.91 M allocations: 179.244 GiB, 3.98% gc time, 7.92% compilation time)EnsembleSolution Solution of length 11 with uType:
SciMLBase.ODESolution{Float64, 2, Vector{Vector{Float64}}, Nothing, Nothing, Vector{Float64}, Vector{Vector{Vector{Float64}}}, Nothing, SciMLBase.ODEProblem{Vector{Float64}, Tuple{Float64, Float64}, true, ModelingToolkit.MTKParameters{Vector{Float64}, Vector{Float64}, Tuple{}, Tuple{}, Tuple{}, Tuple{}}, SciMLBase.ODEFunction{true, SciMLBase.FullSpecialize, ModelingToolkit.GeneratedFunctionWrapper{(2, 3, true), RuntimeGeneratedFunctions.RuntimeGeneratedFunction{(:__mtk_arg_1, :___mtkparameters___, :t), ModelingToolkit.var"#_RGF_ModTag", ModelingToolkit.var"#_RGF_ModTag", (0x51af5124, 0xa1f5a8fe, 0xad2db851, 0x132f74e0, 0x5479c4cf), Nothing}, RuntimeGeneratedFunctions.RuntimeGeneratedFunction{(:ˍ₋out, :__mtk_arg_1, :___mtkparameters___, :t), ModelingToolkit.var"#_RGF_ModTag", ModelingToolkit.var"#_RGF_ModTag", (0x67c8997c, 0x325c24b2, 0x78d1361d, 0x1548d2d4, 0x079f71c0), Nothing}}, LinearAlgebra.UniformScaling{Bool}, Nothing, Nothing, Nothing, Nothing, Nothing, Nothing, Nothing, Nothing, Nothing, Nothing, Nothing, ModelingToolkit.ObservedFunctionCache{ModelingToolkit.System}, Nothing, ModelingToolkit.System, SciMLBase.OverrideInitData{SciMLBase.NonlinearProblem{Nothing, true, ModelingToolkit.MTKParameters{Vector{Float64}, StaticArraysCore.SVector{0, Float64}, Tuple{}, Tuple{}, Tuple{}, Tuple{}}, SciMLBase.NonlinearFunction{true, SciMLBase.FullSpecialize, ModelingToolkit.GeneratedFunctionWrapper{(2, 2, true), RuntimeGeneratedFunctions.RuntimeGeneratedFunction{(:__mtk_arg_1, :___mtkparameters___), ModelingToolkit.var"#_RGF_ModTag", ModelingToolkit.var"#_RGF_ModTag", (0x9e75ff5c, 0x569e6946, 0xdf99c4d0, 0x991dfbdf, 0xc9726560), Nothing}, RuntimeGeneratedFunctions.RuntimeGeneratedFunction{(:ˍ₋out, :__mtk_arg_1, :___mtkparameters___), ModelingToolkit.var"#_RGF_ModTag", ModelingToolkit.var"#_RGF_ModTag", (0x2d711344, 0x7a9ccb96, 0xfcb0d583, 0x804a5d5b, 0x2c777abf), Nothing}}, LinearAlgebra.UniformScaling{Bool}, Nothing, Nothing, Nothing, Nothing, Nothing, Nothing, Nothing, Nothing, Nothing, Nothing, ModelingToolkit.ObservedFunctionCache{ModelingToolkit.System}, Nothing, ModelingToolkit.System, Nothing, Nothing}, Base.Pairs{Symbol, Union{}, Nothing, @NamedTuple{}}, SciMLBase.StandardNonlinearProblem, Nothing, Nothing}, typeof(ModelingToolkit.update_initializeprob!), ComposedFunction{ComposedFunction{typeof(identity), typeof(ModelingToolkit.safe_float)}, SymbolicIndexingInterface.TimeIndependentObservedFunction{ModelingToolkit.GeneratedFunctionWrapper{(2, 2, true), RuntimeGeneratedFunctions.RuntimeGeneratedFunction{(:__mtk_arg_1, :___mtkparameters___), ModelingToolkit.var"#_RGF_ModTag", ModelingToolkit.var"#_RGF_ModTag", (0xd53fca60, 0xb339cf6d, 0xdf17ccf3, 0x352c25bd, 0x99bdcbbf), Nothing}, RuntimeGeneratedFunctions.RuntimeGeneratedFunction{(:ˍ₋out, :__mtk_arg_1, :___mtkparameters___), ModelingToolkit.var"#_RGF_ModTag", ModelingToolkit.var"#_RGF_ModTag", (0x8ab9ab79, 0x2c68cf72, 0x425939a0, 0x66cee397, 0x14267502), Nothing}}}}, ModelingToolkit.var"#initprobpmap_split#977"{ModelingToolkit.var"#_getter#973"{Tuple{ComposedFunction{ModelingToolkit.PConstructorApplicator{typeof(identity)}, ModelingToolkit.ObservedWrapper{false, ModelingToolkit.GeneratedFunctionWrapper{(2, 2, true), RuntimeGeneratedFunctions.RuntimeGeneratedFunction{(:__mtk_arg_1, :___mtkparameters___), ModelingToolkit.var"#_RGF_ModTag", ModelingToolkit.var"#_RGF_ModTag", (0x86d63703, 0xbd74607e, 0xaf9b81f8, 0x3a33ed82, 0xc01338f1), Nothing}, RuntimeGeneratedFunctions.RuntimeGeneratedFunction{(:ˍ₋out, :__mtk_arg_1, :___mtkparameters___), ModelingToolkit.var"#_RGF_ModTag", ModelingToolkit.var"#_RGF_ModTag", (0x81e46fee, 0xd405cd14, 0xb5ff6222, 0x7a7ab9e7, 0x94fd8af1), Nothing}}}}, ComposedFunction{ModelingToolkit.PConstructorApplicator{typeof(identity)}, ModelingToolkit.ObservedWrapper{false, ModelingToolkit.GeneratedFunctionWrapper{(2, 2, true), RuntimeGeneratedFunctions.RuntimeGeneratedFunction{(:__mtk_arg_1, :___mtkparameters___), ModelingToolkit.var"#_RGF_ModTag", ModelingToolkit.var"#_RGF_ModTag", (0x4b7122f6, 0x6a50bf5f, 0x80f5b2cc, 0xab27793b, 0x044ade3c), Nothing}, RuntimeGeneratedFunctions.RuntimeGeneratedFunction{(:ˍ₋out, :__mtk_arg_1, :___mtkparameters___), ModelingToolkit.var"#_RGF_ModTag", ModelingToolkit.var"#_RGF_ModTag", (0x48277390, 0xb56e07ef, 0x09a70bdc, 0xd9cfe231, 0x5c62cdba), Nothing}}}}, Returns{Tuple{}}, Returns{Tuple{}}, Returns{Tuple{}}}}}, ModelingToolkit.InitializationMetadata{ModelingToolkit.ReconstructInitializeprob{ModelingToolkit.var"#_getter#973"{Tuple{ComposedFunction{ModelingToolkit.PConstructorApplicator{typeof(identity)}, ModelingToolkit.ObservedWrapper{true, ModelingToolkit.GeneratedFunctionWrapper{(2, 3, true), RuntimeGeneratedFunctions.RuntimeGeneratedFunction{(:__mtk_arg_1, :___mtkparameters___, :t), ModelingToolkit.var"#_RGF_ModTag", ModelingToolkit.var"#_RGF_ModTag", (0x38721f72, 0xc3c3b8fe, 0x9082b3cc, 0x43fbab18, 0x3abe3d8a), Nothing}, RuntimeGeneratedFunctions.RuntimeGeneratedFunction{(:ˍ₋out, :__mtk_arg_1, :___mtkparameters___, :t), ModelingToolkit.var"#_RGF_ModTag", ModelingToolkit.var"#_RGF_ModTag", (0xc0017b1a, 0x69d945f0, 0xe3cceed6, 0xa3f905c2, 0x6a6895a0), Nothing}}}}, Returns{StaticArraysCore.SVector{0, Float64}}, Returns{Tuple{}}, Returns{Tuple{}}, Returns{Tuple{}}}}, ComposedFunction{typeof(identity), ModelingToolkit.ObservedWrapper{true, ModelingToolkit.GeneratedFunctionWrapper{(2, 3, true), RuntimeGeneratedFunctions.RuntimeGeneratedFunction{(:__mtk_arg_1, :___mtkparameters___, :t), ModelingToolkit.var"#_RGF_ModTag", ModelingToolkit.var"#_RGF_ModTag", (0x9da934f5, 0xde419185, 0x1c689c96, 0xdb85219a, 0xd2ebbc7c), Nothing}, RuntimeGeneratedFunctions.RuntimeGeneratedFunction{(:ˍ₋out, :__mtk_arg_1, :___mtkparameters___, :t), ModelingToolkit.var"#_RGF_ModTag", ModelingToolkit.var"#_RGF_ModTag", (0x0466ff4b, 0x18eddd04, 0x44549885, 0xd768fa8d, 0x13589431), Nothing}}}}}, ModelingToolkit.GetUpdatedU0{SymbolicIndexingInterface.MultipleGetters{SymbolicIndexingInterface.ContinuousTimeseries, Vector{SymbolicUtils.BasicSymbolic{Real}}}, SymbolicIndexingInterface.MultipleParametersGetter{SymbolicIndexingInterface.IndexerNotTimeseries, Vector{SymbolicIndexingInterface.GetParameterIndex{ModelingToolkit.ParameterIndex{SciMLStructures.Initials, Int64}}}, Nothing}}, ModelingToolkit.SetInitialUnknowns{SymbolicIndexingInterface.MultipleSetters{Vector{SymbolicIndexingInterface.ParameterHookWrapper{SymbolicIndexingInterface.SetParameterIndex{ModelingToolkit.ParameterIndex{SciMLStructures.Initials, Int64}}, SymbolicUtils.BasicSymbolic{Real}}}}}}, Val{true}}, Nothing}, Base.Pairs{Symbol, Union{}, Nothing, @NamedTuple{}}, SciMLBase.StandardODEProblem}, OrdinaryDiffEqSDIRK.KenCarp47{0, ADTypes.AutoForwardDiff{nothing, ForwardDiff.Tag{DiffEqBase.OrdinaryDiffEqTag, Float64}}, Nothing, OrdinaryDiffEqNonlinearSolve.NLNewton{Rational{Int64}, Rational{Int64}, Rational{Int64}, Nothing}, typeof(OrdinaryDiffEqCore.DEFAULT_PRECS), Val{:forward}(), true, nothing}, OrdinaryDiffEqCore.InterpolationData{SciMLBase.ODEFunction{true, SciMLBase.FullSpecialize, ModelingToolkit.GeneratedFunctionWrapper{(2, 3, true), RuntimeGeneratedFunctions.RuntimeGeneratedFunction{(:__mtk_arg_1, :___mtkparameters___, :t), ModelingToolkit.var"#_RGF_ModTag", ModelingToolkit.var"#_RGF_ModTag", (0x51af5124, 0xa1f5a8fe, 0xad2db851, 0x132f74e0, 0x5479c4cf), Nothing}, RuntimeGeneratedFunctions.RuntimeGeneratedFunction{(:ˍ₋out, :__mtk_arg_1, :___mtkparameters___, :t), ModelingToolkit.var"#_RGF_ModTag", ModelingToolkit.var"#_RGF_ModTag", (0x67c8997c, 0x325c24b2, 0x78d1361d, 0x1548d2d4, 0x079f71c0), Nothing}}, LinearAlgebra.UniformScaling{Bool}, Nothing, Nothing, Nothing, Nothing, Nothing, Nothing, Nothing, Nothing, Nothing, Nothing, Nothing, ModelingToolkit.ObservedFunctionCache{ModelingToolkit.System}, Nothing, ModelingToolkit.System, SciMLBase.OverrideInitData{SciMLBase.NonlinearProblem{Nothing, true, ModelingToolkit.MTKParameters{Vector{Float64}, StaticArraysCore.SVector{0, Float64}, Tuple{}, Tuple{}, Tuple{}, Tuple{}}, SciMLBase.NonlinearFunction{true, SciMLBase.FullSpecialize, ModelingToolkit.GeneratedFunctionWrapper{(2, 2, true), RuntimeGeneratedFunctions.RuntimeGeneratedFunction{(:__mtk_arg_1, :___mtkparameters___), ModelingToolkit.var"#_RGF_ModTag", ModelingToolkit.var"#_RGF_ModTag", (0x9e75ff5c, 0x569e6946, 0xdf99c4d0, 0x991dfbdf, 0xc9726560), Nothing}, RuntimeGeneratedFunctions.RuntimeGeneratedFunction{(:ˍ₋out, :__mtk_arg_1, :___mtkparameters___), ModelingToolkit.var"#_RGF_ModTag", ModelingToolkit.var"#_RGF_ModTag", (0x2d711344, 0x7a9ccb96, 0xfcb0d583, 0x804a5d5b, 0x2c777abf), Nothing}}, LinearAlgebra.UniformScaling{Bool}, Nothing, Nothing, Nothing, Nothing, Nothing, Nothing, Nothing, Nothing, Nothing, Nothing, ModelingToolkit.ObservedFunctionCache{ModelingToolkit.System}, Nothing, ModelingToolkit.System, Nothing, Nothing}, Base.Pairs{Symbol, Union{}, Nothing, @NamedTuple{}}, SciMLBase.StandardNonlinearProblem, Nothing, Nothing}, typeof(ModelingToolkit.update_initializeprob!), ComposedFunction{ComposedFunction{typeof(identity), typeof(ModelingToolkit.safe_float)}, SymbolicIndexingInterface.TimeIndependentObservedFunction{ModelingToolkit.GeneratedFunctionWrapper{(2, 2, true), RuntimeGeneratedFunctions.RuntimeGeneratedFunction{(:__mtk_arg_1, :___mtkparameters___), ModelingToolkit.var"#_RGF_ModTag", ModelingToolkit.var"#_RGF_ModTag", (0xd53fca60, 0xb339cf6d, 0xdf17ccf3, 0x352c25bd, 0x99bdcbbf), Nothing}, RuntimeGeneratedFunctions.RuntimeGeneratedFunction{(:ˍ₋out, :__mtk_arg_1, :___mtkparameters___), ModelingToolkit.var"#_RGF_ModTag", ModelingToolkit.var"#_RGF_ModTag", (0x8ab9ab79, 0x2c68cf72, 0x425939a0, 0x66cee397, 0x14267502), Nothing}}}}, ModelingToolkit.var"#initprobpmap_split#977"{ModelingToolkit.var"#_getter#973"{Tuple{ComposedFunction{ModelingToolkit.PConstructorApplicator{typeof(identity)}, ModelingToolkit.ObservedWrapper{false, ModelingToolkit.GeneratedFunctionWrapper{(2, 2, true), RuntimeGeneratedFunctions.RuntimeGeneratedFunction{(:__mtk_arg_1, :___mtkparameters___), ModelingToolkit.var"#_RGF_ModTag", ModelingToolkit.var"#_RGF_ModTag", (0x86d63703, 0xbd74607e, 0xaf9b81f8, 0x3a33ed82, 0xc01338f1), Nothing}, RuntimeGeneratedFunctions.RuntimeGeneratedFunction{(:ˍ₋out, :__mtk_arg_1, :___mtkparameters___), ModelingToolkit.var"#_RGF_ModTag", ModelingToolkit.var"#_RGF_ModTag", (0x81e46fee, 0xd405cd14, 0xb5ff6222, 0x7a7ab9e7, 0x94fd8af1), Nothing}}}}, ComposedFunction{ModelingToolkit.PConstructorApplicator{typeof(identity)}, ModelingToolkit.ObservedWrapper{false, ModelingToolkit.GeneratedFunctionWrapper{(2, 2, true), RuntimeGeneratedFunctions.RuntimeGeneratedFunction{(:__mtk_arg_1, :___mtkparameters___), ModelingToolkit.var"#_RGF_ModTag", ModelingToolkit.var"#_RGF_ModTag", (0x4b7122f6, 0x6a50bf5f, 0x80f5b2cc, 0xab27793b, 0x044ade3c), Nothing}, RuntimeGeneratedFunctions.RuntimeGeneratedFunction{(:ˍ₋out, :__mtk_arg_1, :___mtkparameters___), ModelingToolkit.var"#_RGF_ModTag", ModelingToolkit.var"#_RGF_ModTag", (0x48277390, 0xb56e07ef, 0x09a70bdc, 0xd9cfe231, 0x5c62cdba), Nothing}}}}, Returns{Tuple{}}, Returns{Tuple{}}, Returns{Tuple{}}}}}, ModelingToolkit.InitializationMetadata{ModelingToolkit.ReconstructInitializeprob{ModelingToolkit.var"#_getter#973"{Tuple{ComposedFunction{ModelingToolkit.PConstructorApplicator{typeof(identity)}, ModelingToolkit.ObservedWrapper{true, ModelingToolkit.GeneratedFunctionWrapper{(2, 3, true), RuntimeGeneratedFunctions.RuntimeGeneratedFunction{(:__mtk_arg_1, :___mtkparameters___, :t), ModelingToolkit.var"#_RGF_ModTag", ModelingToolkit.var"#_RGF_ModTag", (0x38721f72, 0xc3c3b8fe, 0x9082b3cc, 0x43fbab18, 0x3abe3d8a), Nothing}, RuntimeGeneratedFunctions.RuntimeGeneratedFunction{(:ˍ₋out, :__mtk_arg_1, :___mtkparameters___, :t), ModelingToolkit.var"#_RGF_ModTag", ModelingToolkit.var"#_RGF_ModTag", (0xc0017b1a, 0x69d945f0, 0xe3cceed6, 0xa3f905c2, 0x6a6895a0), Nothing}}}}, Returns{StaticArraysCore.SVector{0, Float64}}, Returns{Tuple{}}, Returns{Tuple{}}, Returns{Tuple{}}}}, ComposedFunction{typeof(identity), ModelingToolkit.ObservedWrapper{true, ModelingToolkit.GeneratedFunctionWrapper{(2, 3, true), RuntimeGeneratedFunctions.RuntimeGeneratedFunction{(:__mtk_arg_1, :___mtkparameters___, :t), ModelingToolkit.var"#_RGF_ModTag", ModelingToolkit.var"#_RGF_ModTag", (0x9da934f5, 0xde419185, 0x1c689c96, 0xdb85219a, 0xd2ebbc7c), Nothing}, RuntimeGeneratedFunctions.RuntimeGeneratedFunction{(:ˍ₋out, :__mtk_arg_1, :___mtkparameters___, :t), ModelingToolkit.var"#_RGF_ModTag", ModelingToolkit.var"#_RGF_ModTag", (0x0466ff4b, 0x18eddd04, 0x44549885, 0xd768fa8d, 0x13589431), Nothing}}}}}, ModelingToolkit.GetUpdatedU0{SymbolicIndexingInterface.MultipleGetters{SymbolicIndexingInterface.ContinuousTimeseries, Vector{SymbolicUtils.BasicSymbolic{Real}}}, SymbolicIndexingInterface.MultipleParametersGetter{SymbolicIndexingInterface.IndexerNotTimeseries, Vector{SymbolicIndexingInterface.GetParameterIndex{ModelingToolkit.ParameterIndex{SciMLStructures.Initials, Int64}}}, Nothing}}, ModelingToolkit.SetInitialUnknowns{SymbolicIndexingInterface.MultipleSetters{Vector{SymbolicIndexingInterface.ParameterHookWrapper{SymbolicIndexingInterface.SetParameterIndex{ModelingToolkit.ParameterIndex{SciMLStructures.Initials, Int64}}, SymbolicUtils.BasicSymbolic{Real}}}}}}, Val{true}}, Nothing}, Vector{Vector{Float64}}, Vector{Float64}, Vector{Vector{Vector{Float64}}}, Nothing, cacheType, Nothing}, SciMLBase.DEStats, Nothing, Nothing, Nothing, Nothing} where cacheType<:(OrdinaryDiffEqSDIRK.KenCarp47Cache{Vector{Float64}, Vector{Float64}, Vector{Float64}, N, OrdinaryDiffEqSDIRK.KenCarp47Tableau{Float64, Float64}, Nothing} where N<:(OrdinaryDiffEqNonlinearSolve.NLSolver{OrdinaryDiffEqNonlinearSolve.NLNewton{Rational{Int64}, Rational{Int64}, Rational{Int64}, Nothing}, true, Vector{Float64}, Float64, Nothing, Float64, OrdinaryDiffEqNonlinearSolve.NLNewtonCache{Vector{Float64}, Float64, Float64, Vector{Float64}, Matrix{Float64}, Matrix{Float64}, SciMLBase.UJacobianWrapper{true, SciMLBase.ODEFunction{true, SciMLBase.FullSpecialize, ModelingToolkit.GeneratedFunctionWrapper{(2, 3, true), RuntimeGeneratedFunctions.RuntimeGeneratedFunction{(:__mtk_arg_1, :___mtkparameters___, :t), ModelingToolkit.var"#_RGF_ModTag", ModelingToolkit.var"#_RGF_ModTag", (0x51af5124, 0xa1f5a8fe, 0xad2db851, 0x132f74e0, 0x5479c4cf), Nothing}, RuntimeGeneratedFunctions.RuntimeGeneratedFunction{(:ˍ₋out, :__mtk_arg_1, :___mtkparameters___, :t), ModelingToolkit.var"#_RGF_ModTag", ModelingToolkit.var"#_RGF_ModTag", (0x67c8997c, 0x325c24b2, 0x78d1361d, 0x1548d2d4, 0x079f71c0), Nothing}}, LinearAlgebra.UniformScaling{Bool}, Nothing, Nothing, Nothing, Nothing, Nothing, Nothing, Nothing, Nothing, Nothing, Nothing, Nothing, ModelingToolkit.ObservedFunctionCache{ModelingToolkit.System}, Nothing, ModelingToolkit.System, SciMLBase.OverrideInitData{SciMLBase.NonlinearProblem{Nothing, true, ModelingToolkit.MTKParameters{Vector{Float64}, StaticArraysCore.SVector{0, Float64}, Tuple{}, Tuple{}, Tuple{}, Tuple{}}, SciMLBase.NonlinearFunction{true, SciMLBase.FullSpecialize, ModelingToolkit.GeneratedFunctionWrapper{(2, 2, true), RuntimeGeneratedFunctions.RuntimeGeneratedFunction{(:__mtk_arg_1, :___mtkparameters___), ModelingToolkit.var"#_RGF_ModTag", ModelingToolkit.var"#_RGF_ModTag", (0x9e75ff5c, 0x569e6946, 0xdf99c4d0, 0x991dfbdf, 0xc9726560), Nothing}, RuntimeGeneratedFunctions.RuntimeGeneratedFunction{(:ˍ₋out, :__mtk_arg_1, :___mtkparameters___), ModelingToolkit.var"#_RGF_ModTag", ModelingToolkit.var"#_RGF_ModTag", (0x2d711344, 0x7a9ccb96, 0xfcb0d583, 0x804a5d5b, 0x2c777abf), Nothing}}, LinearAlgebra.UniformScaling{Bool}, Nothing, Nothing, Nothing, Nothing, Nothing, Nothing, Nothing, Nothing, Nothing, Nothing, ModelingToolkit.ObservedFunctionCache{ModelingToolkit.System}, Nothing, ModelingToolkit.System, Nothing, Nothing}, Base.Pairs{Symbol, Union{}, Nothing, @NamedTuple{}}, SciMLBase.StandardNonlinearProblem, Nothing, Nothing}, typeof(ModelingToolkit.update_initializeprob!), ComposedFunction{ComposedFunction{typeof(identity), typeof(ModelingToolkit.safe_float)}, SymbolicIndexingInterface.TimeIndependentObservedFunction{ModelingToolkit.GeneratedFunctionWrapper{(2, 2, true), RuntimeGeneratedFunctions.RuntimeGeneratedFunction{(:__mtk_arg_1, :___mtkparameters___), ModelingToolkit.var"#_RGF_ModTag", ModelingToolkit.var"#_RGF_ModTag", (0xd53fca60, 0xb339cf6d, 0xdf17ccf3, 0x352c25bd, 0x99bdcbbf), Nothing}, RuntimeGeneratedFunctions.RuntimeGeneratedFunction{(:ˍ₋out, :__mtk_arg_1, :___mtkparameters___), ModelingToolkit.var"#_RGF_ModTag", ModelingToolkit.var"#_RGF_ModTag", (0x8ab9ab79, 0x2c68cf72, 0x425939a0, 0x66cee397, 0x14267502), Nothing}}}}, ModelingToolkit.var"#initprobpmap_split#977"{ModelingToolkit.var"#_getter#973"{Tuple{ComposedFunction{ModelingToolkit.PConstructorApplicator{typeof(identity)}, ModelingToolkit.ObservedWrapper{false, ModelingToolkit.GeneratedFunctionWrapper{(2, 2, true), RuntimeGeneratedFunctions.RuntimeGeneratedFunction{(:__mtk_arg_1, :___mtkparameters___), ModelingToolkit.var"#_RGF_ModTag", ModelingToolkit.var"#_RGF_ModTag", (0x86d63703, 0xbd74607e, 0xaf9b81f8, 0x3a33ed82, 0xc01338f1), Nothing}, RuntimeGeneratedFunctions.RuntimeGeneratedFunction{(:ˍ₋out, :__mtk_arg_1, :___mtkparameters___), ModelingToolkit.var"#_RGF_ModTag", ModelingToolkit.var"#_RGF_ModTag", (0x81e46fee, 0xd405cd14, 0xb5ff6222, 0x7a7ab9e7, 0x94fd8af1), Nothing}}}}, ComposedFunction{ModelingToolkit.PConstructorApplicator{typeof(identity)}, ModelingToolkit.ObservedWrapper{false, ModelingToolkit.GeneratedFunctionWrapper{(2, 2, true), RuntimeGeneratedFunctions.RuntimeGeneratedFunction{(:__mtk_arg_1, :___mtkparameters___), ModelingToolkit.var"#_RGF_ModTag", ModelingToolkit.var"#_RGF_ModTag", (0x4b7122f6, 0x6a50bf5f, 0x80f5b2cc, 0xab27793b, 0x044ade3c), Nothing}, RuntimeGeneratedFunctions.RuntimeGeneratedFunction{(:ˍ₋out, :__mtk_arg_1, :___mtkparameters___), ModelingToolkit.var"#_RGF_ModTag", ModelingToolkit.var"#_RGF_ModTag", (0x48277390, 0xb56e07ef, 0x09a70bdc, 0xd9cfe231, 0x5c62cdba), Nothing}}}}, Returns{Tuple{}}, Returns{Tuple{}}, Returns{Tuple{}}}}}, ModelingToolkit.InitializationMetadata{ModelingToolkit.ReconstructInitializeprob{ModelingToolkit.var"#_getter#973"{Tuple{ComposedFunction{ModelingToolkit.PConstructorApplicator{typeof(identity)}, ModelingToolkit.ObservedWrapper{true, ModelingToolkit.GeneratedFunctionWrapper{(2, 3, true), RuntimeGeneratedFunctions.RuntimeGeneratedFunction{(:__mtk_arg_1, :___mtkparameters___, :t), ModelingToolkit.var"#_RGF_ModTag", ModelingToolkit.var"#_RGF_ModTag", (0x38721f72, 0xc3c3b8fe, 0x9082b3cc, 0x43fbab18, 0x3abe3d8a), Nothing}, RuntimeGeneratedFunctions.RuntimeGeneratedFunction{(:ˍ₋out, :__mtk_arg_1, :___mtkparameters___, :t), ModelingToolkit.var"#_RGF_ModTag", ModelingToolkit.var"#_RGF_ModTag", (0xc0017b1a, 0x69d945f0, 0xe3cceed6, 0xa3f905c2, 0x6a6895a0), Nothing}}}}, Returns{StaticArraysCore.SVector{0, Float64}}, Returns{Tuple{}}, Returns{Tuple{}}, Returns{Tuple{}}}}, ComposedFunction{typeof(identity), ModelingToolkit.ObservedWrapper{true, ModelingToolkit.GeneratedFunctionWrapper{(2, 3, true), RuntimeGeneratedFunctions.RuntimeGeneratedFunction{(:__mtk_arg_1, :___mtkparameters___, :t), ModelingToolkit.var"#_RGF_ModTag", ModelingToolkit.var"#_RGF_ModTag", (0x9da934f5, 0xde419185, 0x1c689c96, 0xdb85219a, 0xd2ebbc7c), Nothing}, RuntimeGeneratedFunctions.RuntimeGeneratedFunction{(:ˍ₋out, :__mtk_arg_1, :___mtkparameters___, :t), ModelingToolkit.var"#_RGF_ModTag", ModelingToolkit.var"#_RGF_ModTag", (0x0466ff4b, 0x18eddd04, 0x44549885, 0xd768fa8d, 0x13589431), Nothing}}}}}, ModelingToolkit.GetUpdatedU0{SymbolicIndexingInterface.MultipleGetters{SymbolicIndexingInterface.ContinuousTimeseries, Vector{SymbolicUtils.BasicSymbolic{Real}}}, SymbolicIndexingInterface.MultipleParametersGetter{SymbolicIndexingInterface.IndexerNotTimeseries, Vector{SymbolicIndexingInterface.GetParameterIndex{ModelingToolkit.ParameterIndex{SciMLStructures.Initials, Int64}}}, Nothing}}, ModelingToolkit.SetInitialUnknowns{SymbolicIndexingInterface.MultipleSetters{Vector{SymbolicIndexingInterface.ParameterHookWrapper{SymbolicIndexingInterface.SetParameterIndex{ModelingToolkit.ParameterIndex{SciMLStructures.Initials, Int64}}, SymbolicUtils.BasicSymbolic{Real}}}}}}, Val{true}}, Nothing}, Float64, ModelingToolkit.MTKParameters{Vector{Float64}, Vector{Float64}, Tuple{}, Tuple{}, Tuple{}, Tuple{}}}, jcType, LinearSolve.LinearCache{Matrix{Float64}, Vector{Float64}, Vector{Float64}, SciMLBase.NullParameters, LinearSolve.DefaultLinearSolver, LinearSolve.DefaultLinearSolverInit{LinearAlgebra.LU{Float64, Matrix{Float64}, Vector{Int64}}, LinearAlgebra.QRCompactWY{Float64, Matrix{Float64}, Matrix{Float64}}, Nothing, Nothing, Nothing, Nothing, Nothing, Nothing, Tuple{LinearAlgebra.LU{Float64, Matrix{Float64}, Vector{Int64}}, Vector{Int64}}, Tuple{LinearAlgebra.LU{Float64, Matrix{Float64}, Vector{Int64}}, Vector{Int64}}, Nothing, Nothing, Nothing, LinearAlgebra.SVD{Float64, Float64, Matrix{Float64}, Vector{Float64}}, LinearAlgebra.Cholesky{Float64, Matrix{Float64}}, LinearAlgebra.Cholesky{Float64, Matrix{Float64}}, Tuple{LinearAlgebra.LU{Float64, Matrix{Float64}, Vector{Int32}}, Base.RefValue{Int32}}, Tuple{LinearAlgebra.LU{Float64, Matrix{Float64}, Vector{Int64}}, Base.RefValue{Int64}}, LinearAlgebra.QRPivoted{Float64, Matrix{Float64}, Vector{Float64}, Vector{Int64}}, Nothing, Nothing, Nothing, Nothing, Nothing}, LinearSolve.InvPreconditioner{LinearAlgebra.Diagonal{Float64, Vector{Float64}}}, LinearAlgebra.Diagonal{Float64, Vector{Float64}}, Float64, LinearSolve.LinearVerbosity{SciMLLogging.Silent, SciMLLogging.Silent, SciMLLogging.Silent, SciMLLogging.Silent, SciMLLogging.CustomLevel, SciMLLogging.Silent, SciMLLogging.InfoLevel, SciMLLogging.Silent, SciMLLogging.WarnLevel, SciMLLogging.WarnLevel, SciMLLogging.Silent, SciMLLogging.Silent, SciMLLogging.Silent, SciMLLogging.WarnLevel, SciMLLogging.WarnLevel, SciMLLogging.WarnLevel}, Bool, LinearSolve.LinearSolveAdjoint{Missing}}}, Float64} where jcType<:Tuple{DifferentiationInterfaceForwardDiffExt.ForwardDiffTwoArgJacobianPrep{Nothing, C, Tuple{}} where C<:(ForwardDiff.JacobianConfig{ForwardDiff.Tag{DiffEqBase.OrdinaryDiffEqTag, Float64}, Float64, _A, <:Tuple{Array{ForwardDiff.Dual{ForwardDiff.Tag{DiffEqBase.OrdinaryDiffEqTag, Float64}, Float64, _A}, 1} where _A, Array{ForwardDiff.Dual{ForwardDiff.Tag{DiffEqBase.OrdinaryDiffEqTag, Float64}, Float64, _A}, 1} where _A}} where _A), DifferentiationInterfaceForwardDiffExt.ForwardDiffTwoArgJacobianPrep{Nothing, C, Tuple{}} where C<:(ForwardDiff.JacobianConfig{ForwardDiff.Tag{DiffEqBase.OrdinaryDiffEqTag, Float64}, Float64, _A, <:Tuple{Array{ForwardDiff.Dual{ForwardDiff.Tag{DiffEqBase.OrdinaryDiffEqTag, Float64}, Float64, _A}, 1} where _A, Array{ForwardDiff.Dual{ForwardDiff.Tag{DiffEqBase.OrdinaryDiffEqTag, Float64}, Float64, _A}, 1} where _A}} where _A)}))Time series
fig = plot(title="MMP")
for (i, dox) in enumerate(doxrange)
    plot!(fig, sim[i], idxs=(sys.t/1000, sys.dpsi), lab="DOX = $(dox) μM")
end
plot!(fig, ylabel="mV", xlabel="Time (s)")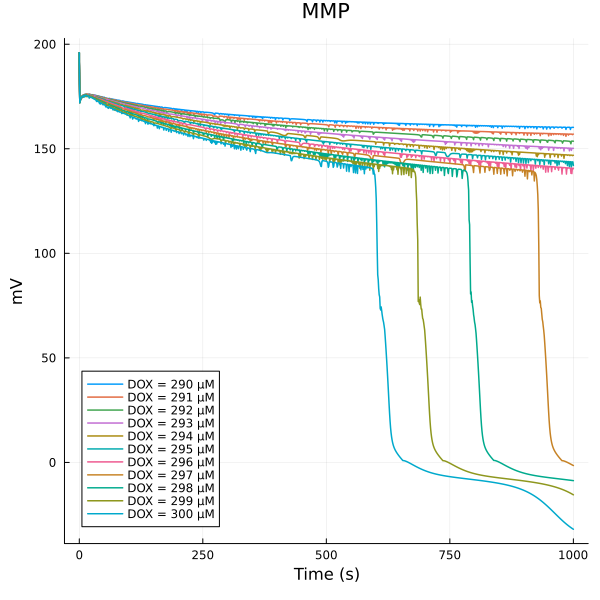
fig = plot(title="ATP")
for (i, dox) in enumerate(doxrange)
    plot!(fig, sim[i], idxs=(sys.t/1000, sys.atp_i), lab="DOX = $(dox) μM")
end
plot!(fig, ylabel="Conc. (μM)", xlabel="Time (s)", legend=:bottomright, ylim=(0, 8mM))
fig = plot(title="Cytosolic superoxide")
for (i, dox) in enumerate(doxrange)
    plot!(fig, sim[i], idxs=(sys.t/1000, sys.sox_i), lab="DOX = $(dox) μM")
end
plot!(fig, ylabel="Conc. (μM)", xlabel="Time (s)", legend=:right)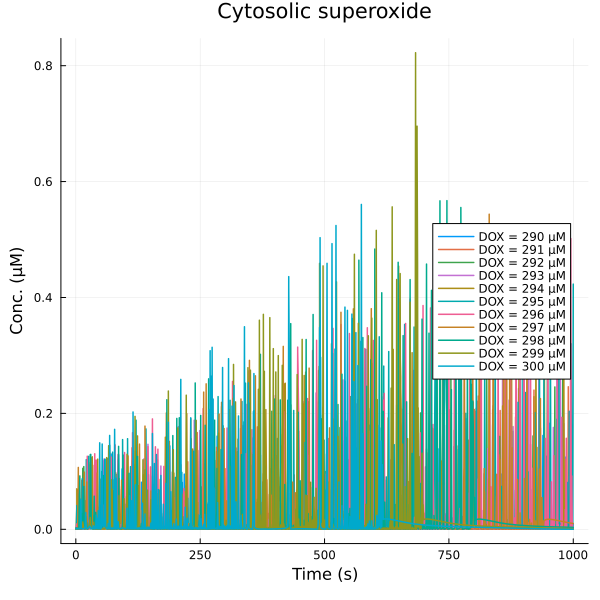
fig = plot(title="Mitochondrial superoxide")
for (i, dox) in enumerate(doxrange)
    plot!(fig, sim[i], idxs=(sys.t/1000, sys.sox_m), lab="DOX = $(dox) μM")
end
plot!(fig, ylabel="Conc. (μM)", xlabel="Time (s)", legend=:topright)
fig = plot(title="Superoxide production")
for (i, dox) in enumerate(doxrange)
    plot!(fig, sim[i], idxs=(sys.t/1000, sys.vROS), lab="DOX = $(dox) μM")
end
plot!(fig, ylabel="Rate (μM/ms)", xlabel="Time (s)", legend=:right)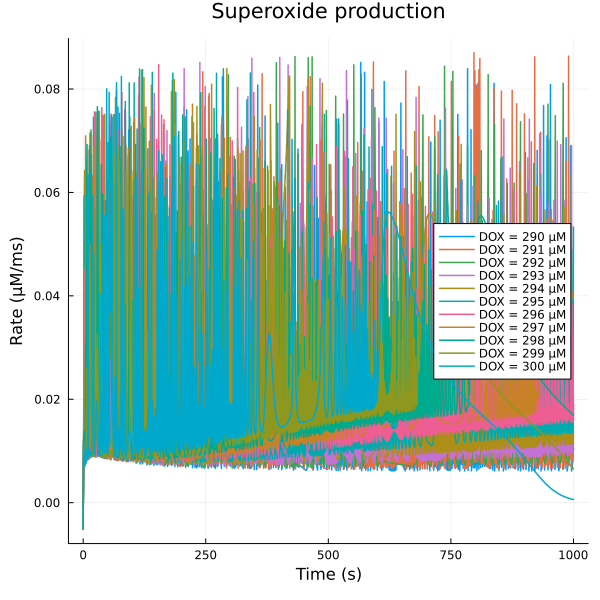
fig = plot(title="O2 shunt")
for (i, dox) in enumerate(doxrange)
    plot!(fig, sim[i], idxs=(sys.t/1000, 100*sys.vROS / (sys.vO2 + sys.vROS)), lab="DOX = $(dox) μM")
end
plot!(fig, ylabel="Percentage (%)", xlabel="Time (s)", legend=:right)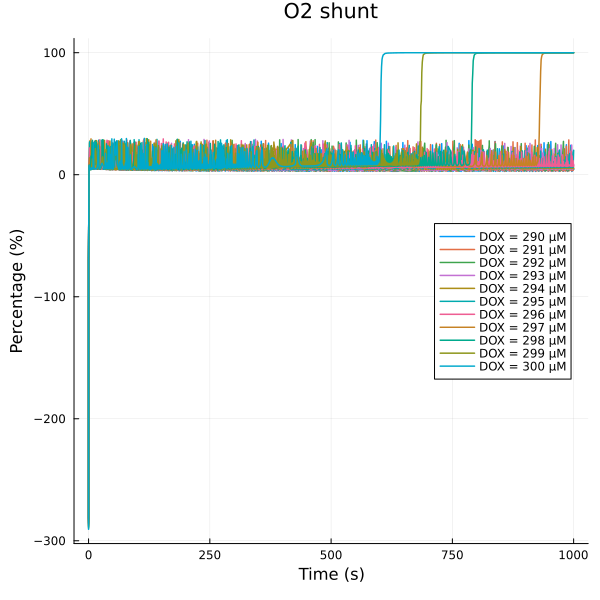
Q cycle
@unpack Q_n, SQn, QH2_n, QH2_p, Q_p, fes_ox, fes_rd, cytc_ox, cytc_rd = sys
plot(sim[end], idxs=[Q_n + Q_p, SQn, QH2_n+QH2_p], title="Q cycle ", legend=:right)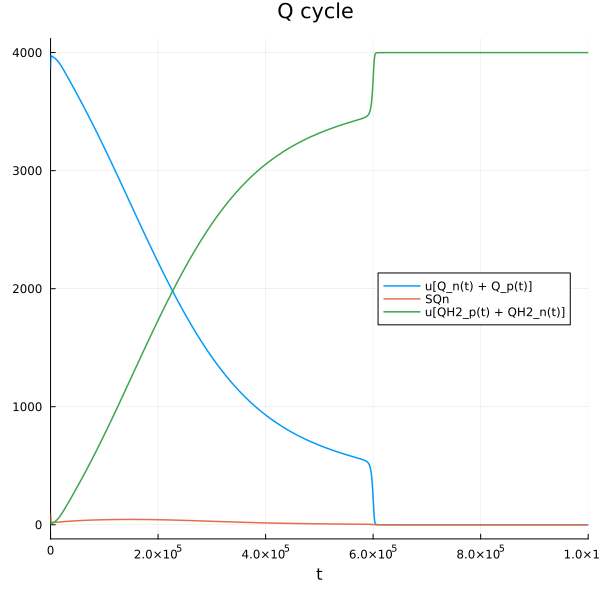
plot(sim[end], idxs=[fes_ox, fes_rd, cytc_ox, cytc_rd], title="Q cycle (downstream)", legend=:right)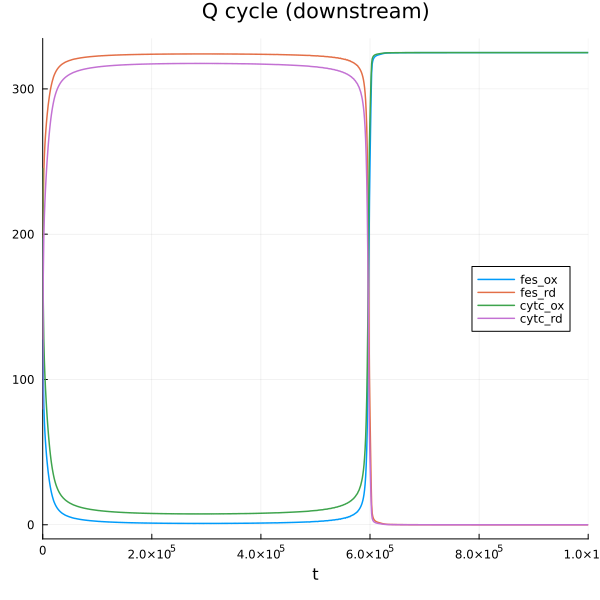
@unpack cit, isoc, oaa, akg, scoa, suc, fum, mal, nadh_m = sys
plot(sim[end], idxs=[cit, isoc, oaa, akg, scoa, suc, fum, mal, nadh_m], title="TCA cycle ", legend=:right)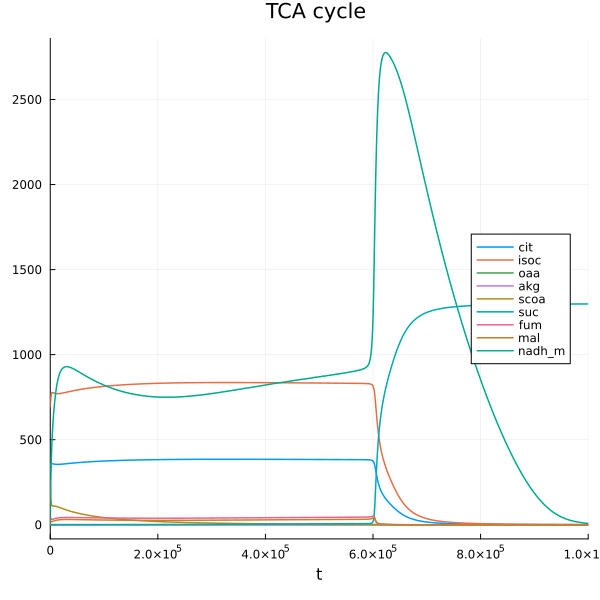
This notebook was generated using Literate.jl.