using Agents
using StaticArrays
import DelaunayTriangulation as DT
using DelaunayTriangulation
using LinearAlgebra
using StreamSampling
using Random
using StatsBase
using CairoMakie
CairoMakie.activate!(px_per_unit = 0.5)Cell division model
https://juliadynamics.github.io/Agents.jl/stable/examples/delaunay/
Using https://github.com/JuliaDynamics/Agents.jl and https://github.com/JuliaGeometry/DelaunayTriangulation.jl
Define agents (3 colors of cells)
@enum CellType begin
Red
Blue
Orange
end
@agent struct Cell(ContinuousAgent{2,Float64})
const color::CellType
const birth::Float64
death::Float64 = Inf
endDefining methods for the agents
DT.getx(cell::Cell) = cell.pos[1]
DT.gety(cell::Cell) = cell.pos[2]
DT.number_type(::Type{Cell}) = Float64
DT.number_type(::Type{Vector{Cell}}) = Float64
DT.is_point2(::Cell) = trueCompute parameters for a pair of cells
spring_constant(model, i::Int, j::Int, t) = spring_constant(model, model[i], model[j], t)
function spring_constant(model, p::Cell, q::Cell, t; μ=20.0)
δ = norm(p.pos - q.pos)
s = rest_length(model, p, q, t)
t < 1 && return μ ## no adhesion for the initial population
μₕₑₜ = ifelse(p.color == q.color, 1.0, 0.1) ## heterotypic_spring_constant
return ifelse(δ > s, μₕₑₜ * μ, μ)
endspring_constant (generic function with 2 methods)rest_length(model, i::Int, j::Int, t) = rest_length(model, model[i], model[j]..., t)
function rest_length(model, p, q, t;
s=1.0, ## mature_cell_spring_rest_length
ε=0.05, ## expansion_rate
)
return min(s, (s - ε) * t + ε)
endrest_length (generic function with 2 methods)function proliferation_rate(model, i::Int, t; tₘᵢₙ = 1.0, K=100.0^2, Aₘᵢₙ=0.01)
p = model[i]
age = t - p.birth
tₘₐₓ = p.color == Red ? 15.0 : p.color == Blue ? 20.0 : 3.0
A = get_area(model.tessellation, i)
if age ≤ tₘᵢₙ || age ≥ tₘₐₓ || A < Aₘᵢₙ
return 0.0
end
Aᵢ = get_area(model.tessellation, i)
β = p.color == Red ? 0.4 : p.color == Blue ? 0.5 : 0.8
return max(0.0, β * (1 - 1 / (K * Aᵢ)))
endproliferation_rate (generic function with 1 method)Forces between two cells
force(model, i::Int, j::Int, t) = force(model, model[i], model[j], t)
function force(model, p::Cell, q::Cell, t; ℓₘₐₓ = 1.5)
rᵢⱼ = q.pos - p.pos
δ = norm(rᵢⱼ)
if δ > ℓₘₐₓ
return SVector(0.0, 0.0)
end
μ = spring_constant(model, p, q, t)
s = rest_length(model, p, q, t)
return μ * (δ - s) * rᵢⱼ / δ
endforce (generic function with 2 methods)Final random tug
function random_force(model, i::Int; ξ=0.01)
p = model[i]
Δt = model.dt
return sqrt(2ξ / Δt) * SVector(randn(), randn())
endrandom_force (generic function with 1 method)Accumulate forces acting on one cell
function force(model, i::Int, t)
F = SVector(0.0, 0.0)
for j in get_neighbours(model.triangulation, i)
DT.is_ghost_vertex(j) && continue
F = F + force(model, i, j, t)
end
F = F + random_force(model, i)
return F
endforce (generic function with 3 methods)Cell movement velocity
velocity(model, i, t; η=0.5) = force(model, i, t) / ηvelocity (generic function with 1 method)First update_velocities!() and then update_positions!() for each cell to avoid positional errors
function update_velocities!(model, t)
for i in each_solid_vertex(model.triangulation)
model[i].vel = velocity(model, i, t)
end
return model
end
function new_position(model, i, t)
xᵢ = model[i]
r = xᵢ.pos + model.dt * xᵢ.vel
x, y = r
xmax, ymax = spacesize(model)
# Freeze if the new position is out of bounds
if x < 0 || x > xmax || y < 0 || y > ymax
r = xᵢ.pos
end
return r
end
function update_positions!(model, t)
update_velocities!(model, t)
for i in each_solid_vertex(model.triangulation)
model[i].pos = new_position(model, i, t)
end
return model
endupdate_positions! (generic function with 1 method)Cumulative sum of proliferation probabilities
function proliferation_probability(model, t)
Δt = model.dt
# Technically nagents is not the number of alive agents, but with the way we are handling agents this is correct
probs = zeros(nagents(model))
for i in allids(model)
# Skip empty and dead cells
if !DT.has_vertex(model.triangulation, i) || (i ∈ model.dead_cells)
probs[i] = 0.0
else
probs[i] = proliferation_rate(model, i, t) * Δt
end
end
return probs
end
select_proliferative_cell(model, probs) = StatsBase.sample(weights(probs))select_proliferative_cell (generic function with 1 method)sampling from a Voronoi cell
function sample_triangle(tri::Triangulation, T)
i, j, k = triangle_vertices(T)
p, q, r = get_point(tri, i, j, k)
px, py = getxy(p)
qx, qy = getxy(q)
rx, ry = getxy(r)
a = (qx - px, qy - py)
b = (rx - px, ry - py)
u₁, u₂ = rand(), rand()
if u₁ + u₂ > 1
u₁, u₂ = 1 - u₁, 1 - u₂
end
ax, ay = getxy(a)
bx, by = getxy(b)
wx, wy = u₁ * ax + u₂ * bx, u₁ * ay + u₂ * by
return SVector(px + wx, py + wy)
endsample_triangle (generic function with 1 method)select a random triangle from a triangulation
function random_triangle(tri::Triangulation)
triangles = DT.each_solid_triangle(tri)
area(T) = DT.triangle_area(get_point(tri, triangle_vertices(T)...)...)
T = itsample(triangles, area)
return T
endrandom_triangle (generic function with 1 method)First, triangulate the Voronoi cell. Then, sample a triangle from the triangulation, and finally sample a point from the triangle
function triangulate_voronoi_cell(vorn::VoronoiTessellation, i)
S = @view get_polygon(vorn, i)[1:end-1]
points = DT.get_polygon_points(vorn)
return triangulate_convex(points, S)
end
function sample_voronoi_cell(vorn::VoronoiTessellation, i)
tri = triangulate_voronoi_cell(vorn, i)
T = random_triangle(tri)
return sample_triangle(tri, T)
end
mutation_probability(p) = p.color == Red ? 0.3 : p.color == Blue ? 0.5 : 0.05 # pₘᵤₜmutation_probability (generic function with 1 method)computing the daughter cell and performing the proliferation event.
function place_daughter_cell!(model, i::Int, t)
parent = model[i]
# this is an SVector, not a Cell
daughterpos = sample_voronoi_cell(model.tessellation, i)
u = rand()
clr = parent.color
if u < mutation_probability(parent)
newclr = clr == Red ? Blue : clr == Blue ? Orange : Red
else
newclr = clr
end
add_agent!(daughterpos, model; color=newclr, birth=t, vel=SVector(0.0, 0.0))
return daughterpos
end
function proliferate_cells!(model, t)
probs = proliferation_probability(model, t)
u = rand()
event = u < sum(probs)
!event && return false
i = select_proliferative_cell(model, probs)
daughterpos = place_daughter_cell!(model, i, t)
return true
end
max_age(p) = p.color == Red ? 10.0 : p.color == Blue ? 10.0 : 3.0 # dₘₐₓ
death_rate(p) = p.color == Red ? 0.001 : p.color == Blue ? 0.00005 : 0.0001 # psickdeath_rate (generic function with 1 method)Mark cell i as dead
function cull_cell!(model, i::Int, t)
p = model[i]
elder = t - p.birth> max_age(p)
sick = rand() < model.dt * death_rate(p)
xmax, ymax = spacesize(model)
x, y = p.pos
outside = x < 0 || x > xmax || y < 0 || y > ymax
if elder || sick || outside
push!(model.dead_cells, i)
p.death = t
end
return model
end
function cull_cells!(model, t)
for i in each_solid_vertex(model.triangulation)
cull_cell!(model, i, t)
end
return model
endcull_cells! (generic function with 1 method)(Finally,) define the stepping function of the ABModel
function model_step!(model)
stepn = abmtime(model)
t = stepn * model.dt
cull_cells!(model, t)
proliferate_cells!(model, t)
update_positions!(model, t)
points = [a.pos for a in allagents(model)]
model.triangulation = retriangulate(model.triangulation, points; skip_points=model.dead_cells)
model.tessellation = voronoi(model.triangulation, clip=true)
return model
endmodel_step! (generic function with 1 method)Initialize the model
function initialize_cell_model(;
ninit=50,
radius=2.0,
dt=0.01,
sides=SVector(20.0, 20.0),
seed=0)
Random.seed!(seed)
# Generate the initial random positions
cent = SVector(sides[1] / 2, sides[2] / 2)
cells = map(1:ninit) do i
θ = 2π * rand()
r = radius * sqrt(rand())
pos = cent + SVector(r * cos(θ), r * sin(θ))
cell = Cell(; id=i, pos=pos,
color=Red, birth=0.0, vel=SVector(0.0, 0.0))
end
positions = [cell.pos for cell in cells]
# Compute the triangulation and the tessellation
triangulation = triangulate(positions)
tessellation = voronoi(triangulation, clip=true)
# Define the model parameters
properties = Dict(
:triangulation => triangulation,
:tessellation => tessellation,
:dt => dt,
:dead_cells => Set{Int}()
)
# Define the space
space = ContinuousSpace(sides; periodic=false)
# Define the model
model = StandardABM(Cell, space; model_step!, properties, container=Vector)
# Add cells
for (id, pos) in pairs(positions)
add_agent!(pos, model; color=Red, birth=0.0, vel=SVector(0.0, 0.0))
end
return model
endinitialize_cell_model (generic function with 1 method)Helper functions
function count_cell_type(model, type)
stepn = abmtime(model)
t = stepn * model.dt
n = 0
for i in each_solid_vertex(model.triangulation)
n += model[i].color == type
end
return n
end
count_red(model) = count_cell_type(model, Red)
count_blue(model) = count_cell_type(model, Blue)
count_orange(model) = count_cell_type(model, Orange)
count_total(model) = num_solid_vertices(model.triangulation)
function average_cell_area(model)
area_itr = (get_area(model.tessellation, i) for i in each_solid_vertex(model.triangulation))
mean_area = mean(area_itr)
return mean_area
end
function cell_diameter(vorn, i)
S = get_polygon(vorn, i)
# This is an O(|S|^2) method, but |S| is small so it is fine
max_d = 0.0
for i in S
p = get_polygon_point(vorn, i)
for j in S
i == j && continue
q = get_polygon_point(vorn, j)
d = norm(getxy(p) .- getxy(q))
max_d = max(max_d, d)
end
end
return max_d
end
function average_cell_diameter(model)
diam_itr = (cell_diameter(model.tessellation, i) for i in each_solid_vertex(model.triangulation))
mean_diam = mean(diam_itr)
return mean_diam
end
function average_spring_length(model)
spring_itr = (norm(model[i].pos - model[j].pos) for (i, j) in each_solid_edge(model.triangulation))
mean_spring = mean(spring_itr)
return mean_spring
endaverage_spring_length (generic function with 1 method)Run the simulations
finalT = 50.0
model = initialize_cell_model()
nsteps = Int(finalT / model.dt)
mdata = [count_red, count_blue, count_orange, count_total,
average_cell_area, average_cell_diameter, average_spring_length]
@time agent_df, model_df = run!(model, nsteps; mdata);106.314101 seconds (329.74 M allocations: 44.683 GiB, 3.93% gc time, 12.28% compilation time)Visualize using CairoMakie
time = 0:model.dt:finalT
fig = Figure(fontsize=24)
ax = Axis(fig[1, 1], xlabel="Time", ylabel="Count", width=600, height=400)
lines!(ax, time, model_df[!, :count_red], color=:red, label="Red", linewidth=3)
lines!(ax, time, model_df[!, :count_blue], color=:blue, label="Blue", linewidth=3)
lines!(ax, time, model_df[!, :count_orange], color=:orange, label="Orange", linewidth=3)
lines!(ax, time, model_df[!, :count_total], color=:black, label="Total", linewidth=3)
axislegend(ax, position=:lt)
ax = Axis(fig[1, 2], xlabel="Time", ylabel="Average", width=600, height=400)
lines!(ax, time, model_df[!, :average_cell_area], color=:black, label="Cell area", linewidth=3)
lines!(ax, time, model_df[!, :average_cell_diameter], color=:magenta, label="Cell diameter", linewidth=3)
lines!(ax, time, model_df[!, :average_spring_length], color=:red, label="Spring length", linewidth=3)
axislegend(ax, position=:rb)
resize_to_layout!(fig)
fig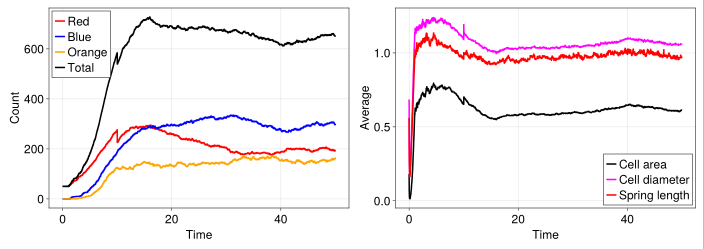
Animate the results
voronoi_marker = (model, cell) -> begin
id = cell.id
verts = get_polygon_coordinates(model.tessellation, id)
return Makie.Polygon([Point2f(getxy(q) .- cell.pos) for q in verts])
end
voronoi_color(cell) = cell.color == Red ? :red : cell.color == Blue ? :blue : :orange
model = initialize_cell_model() ## reinitialise the model for the animation
fig, ax, amobs = abmplot(model, agent_marker=cell -> voronoi_marker(model, cell), agent_color=voronoi_color,
agentsplotkwargs=(strokewidth=1,), figure=(; size=(1600, 800), fontsize=34), mdata=mdata,
axis=(; width=800, height=800), when=10)
current_time = Observable(0.0)
t = Observable([0.0])
nred = Observable(amobs.mdf[][!, :count_red])
nblue = Observable(amobs.mdf[][!, :count_blue])
norange = Observable(amobs.mdf[][!, :count_orange])
ntotal = Observable(amobs.mdf[][!, :count_total])
avg_area = Observable(amobs.mdf[][!, :average_cell_area])
avg_diam = Observable(amobs.mdf[][!, :average_cell_diameter])
avg_spring = Observable(amobs.mdf[][!, :average_spring_length])
plot_layout = fig[:, end+1] = GridLayout()
count_layout = plot_layout[1, 1] = GridLayout()
ax_count = Axis(count_layout[1, 1], xlabel="Time", ylabel="Count", width=600, height=400)
lines!(ax_count, t, nred, color=:red, label="Red", linewidth=3)
lines!(ax_count, t, nblue, color=:blue, label="Blue", linewidth=3)
lines!(ax_count, t, norange, color=:orange, label="Orange", linewidth=3)
lines!(ax_count, t, ntotal, color=:black, label="Total", linewidth=3)
vlines!(ax_count, current_time, color=:grey, linestyle=:dash, linewidth=3)
xlims!(ax_count, 0, finalT)
ylims!(ax_count, 0, 800)
avg_layout = plot_layout[2, 1] = GridLayout()
ax_avg = Axis(avg_layout[1, 1], xlabel="Time", ylabel="Average", width=600, height=400)
lines!(ax_avg, t, avg_area, color=:black, label="Cell area", linewidth=3)
lines!(ax_avg, t, avg_diam, color=:magenta, label="Cell diameter", linewidth=3)
lines!(ax_avg, t, avg_spring, color=:red, label="Spring length", linewidth=3)
vlines!(ax_avg, current_time, color=:grey, linestyle=:dash, linewidth=3)
axislegend(ax_avg, position=:rt)
xlims!(ax_avg, 0, finalT)
ylims!(ax_avg, 0, 2)
resize_to_layout!(fig)
on(amobs.mdf) do mdf
current_time[] = abmtime(amobs.model[]) * model.dt
t.val = mdf[!, :time] .* model.dt
nred[] = mdf[!, :count_red]
nblue[] = mdf[!, :count_blue]
norange[] = mdf[!, :count_orange]
ntotal[] = mdf[!, :count_total]
avg_area[] = mdf[!, :average_cell_area]
avg_diam[] = mdf[!, :average_cell_diameter]
avg_spring[] = mdf[!, :average_spring_length]
endObserverFunction defined at /home/github/actions-runner-1/_work/jl-abm/jl-abm/docs/09-celldiv.ipynb:41 operating on Observable(1×8 DataFrame Row │ time count_red count_blue count_orange count_total average_cell_a ⋯ │ Int64 Int64 Int64 Int64 Int64 Float64 ⋯ ─────┼────────────────────────────────────────────────────────────────────────── 1 │ 0 50 0 0 50 0.181 ⋯ 3 columns omitted)
Record the results for every 10 steps
vio = Makie.Record(fig, 1:(nsteps ÷ 10), framerate=24) do i
step!(amobs, 10)
end