Model of phage lambda decision switch
using ComponentArrays: ComponentArray
using OrdinaryDiffEq
using SimpleUnPack
using CairoMakie
Model
function model711(u, p, t)
    @unpack K1, K2, K3, K4, delta_r, delta_c, a, b = p
    @unpack r, c = u
    rd = r / 2
    cd = c / 2
    f1 = K1 * rd^2
    f2 = K2 * rd
    f3 = K3 * cd
    f4 = K4 * cd
    den = 1 + f1 * (1 + f2) + f3 * (1 + f4)
    Dr = a * (1 + 10 * f1) / den - delta_r * r
    Dc = b * (1 + f3) / den - delta_c * c
    return (; dr = Dr, dc = Dc)
end

function model711!(D, u, p, t)
    dr, dc = model711(u, p, t)
    D.r = dr
    D.c = dc
    nothing
end
model711! (generic function with 1 method)ps711 = ComponentArray(
K1=1,
K2=0.1,
K3=5,
K4=0.5,
delta_r=0.02,
delta_c=0.02,
a=5,
b=50,
)
u0711 = ComponentArray(
r=0.0,
c=0.0,
)ComponentVector{Float64}(r = 0.0, c = 0.0)Fig 7.11 (A)
tend = 6000.0
prob = ODEProblem(model711!, u0711, tend, ps711)
∂F711  = function (x, y)
    dr, dc = model711((; r=x, c=y), ps711, nothing)
    return Point2d(dr, dc)
end

xx = range(0, 250, 101)
yy = range(0, 250, 101)

∂A711 = [model711((; r=x, c=y), ps711, nothing).dr for x in xx, y in yy]
∂B711 = [model711((; r=x, c=y), ps711, nothing).dc for x in xx, y in yy];

fig = Figure(size=(600, 600))
ax = Axis(fig[1, 1],
    xlabel = "[cI] (nM)",
    ylabel = "[cro] (nM)",
    title = "Fig. 7.11 (A)"
)
streamplot!(ax, ∂F711, xx, yy)
contour!(ax, xx, yy, ∂A711, levels=[0], color=:black, linestyle=:solid, linewidth=2, label="R nullcline")
contour!(ax, xx, yy, ∂B711, levels=[0], color=:black, linestyle=:dash, linewidth=2, label="C nullcline")
axislegend(ax, position = :rc)
limits!(ax, 0.0, 250.0, 0.0, 250.0)
fig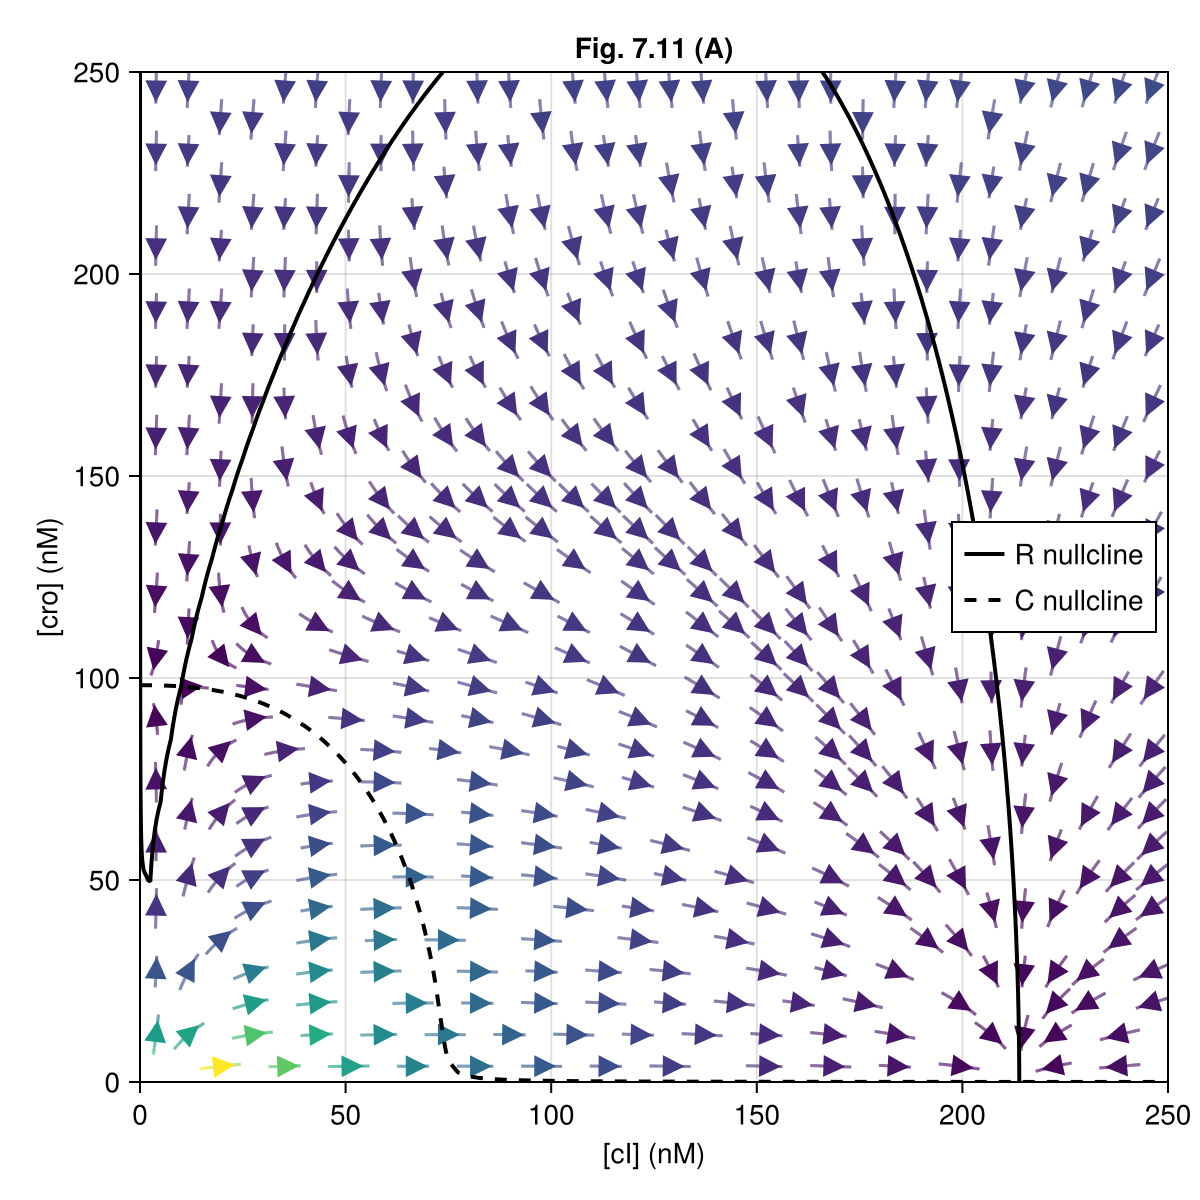
Fig 7.11 (B)
ps711b = ComponentArray(ps711; delta_r = 0.2)
prob2 = remake(prob, p = ps711b)

xx = range(0, 250, 101)
yy = range(0, 250, 101)
∂A711B = [model711((; r=x, c=y), ps711b, nothing).dr for x in xx, y in yy]
∂B711B = [model711((; r=x, c=y), ps711b, nothing).dc for x in xx, y in yy];
∂F711B  = function (x, y)
    dr, dc = model711((; r=x, c=y), ps711b, nothing)
    return Point2d(dr, dc)
end

fig = Figure(size=(600, 600))
ax = Axis(fig[1, 1],
    xlabel = "[cI] (nM)",
    ylabel = "[cro] (nM)",
    title = "Fig. 7.11 (B)"
)
streamplot!(ax, ∂F711B, xx, yy)
contour!(ax, xx, yy, ∂A711B, levels=[0], color=:black, linestyle=:solid, linewidth=2, label="R nullcline")
contour!(ax, xx, yy, ∂B711B, levels=[0], color=:black, linestyle=:dash, linewidth=2, label="C nullcline")
axislegend(ax, position = :rc)
limits!(ax, 0.0, 250.0, 0.0, 250.0)
fig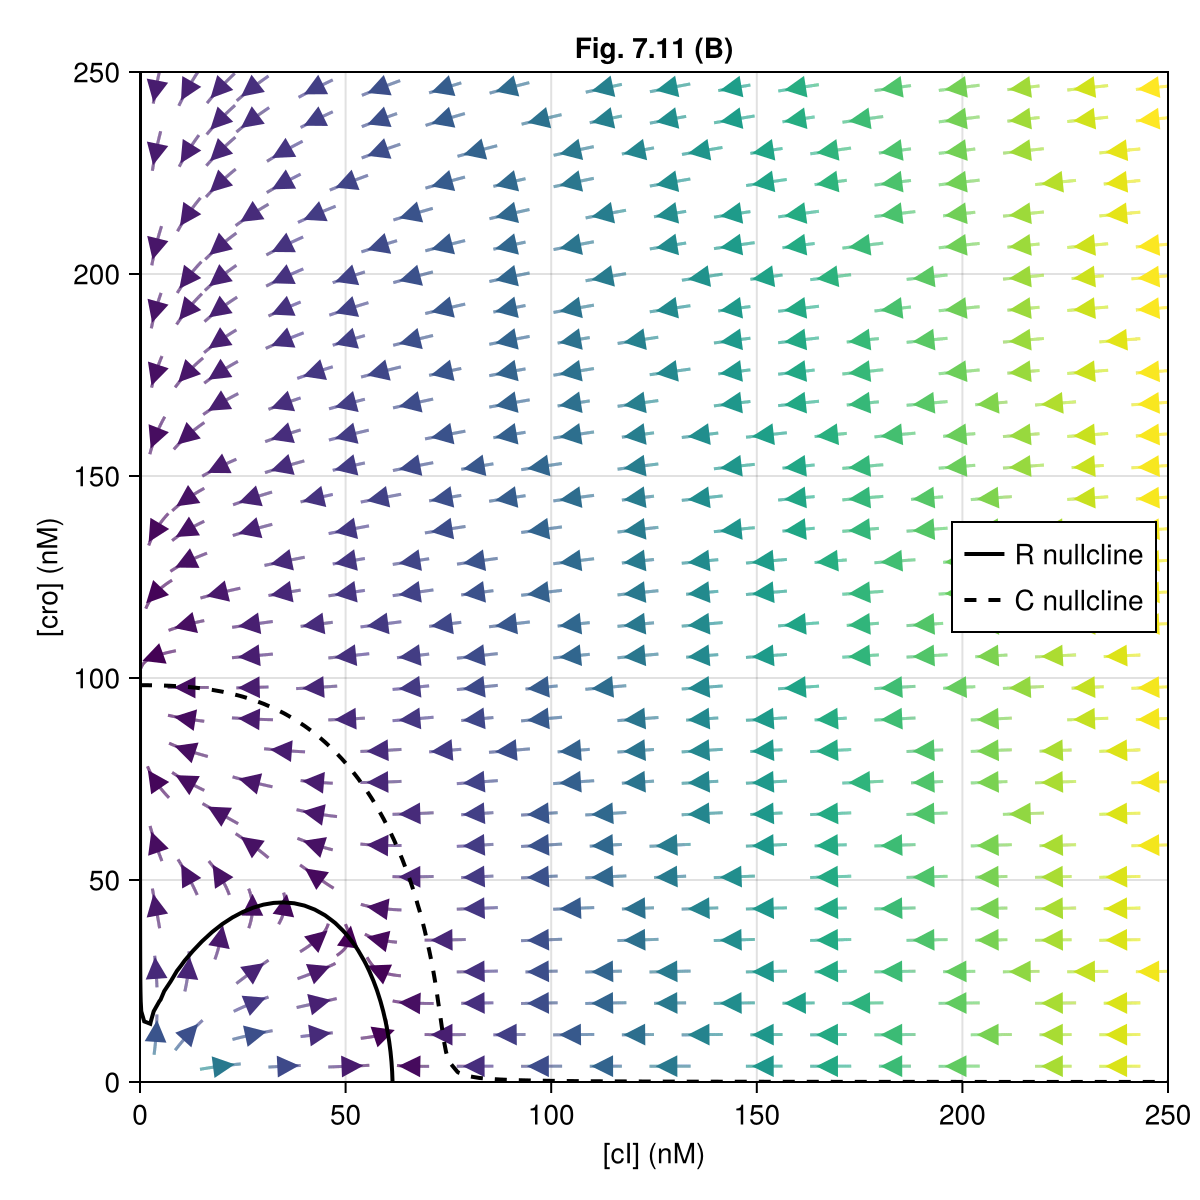
This notebook was generated using Literate.jl.