Surface plots
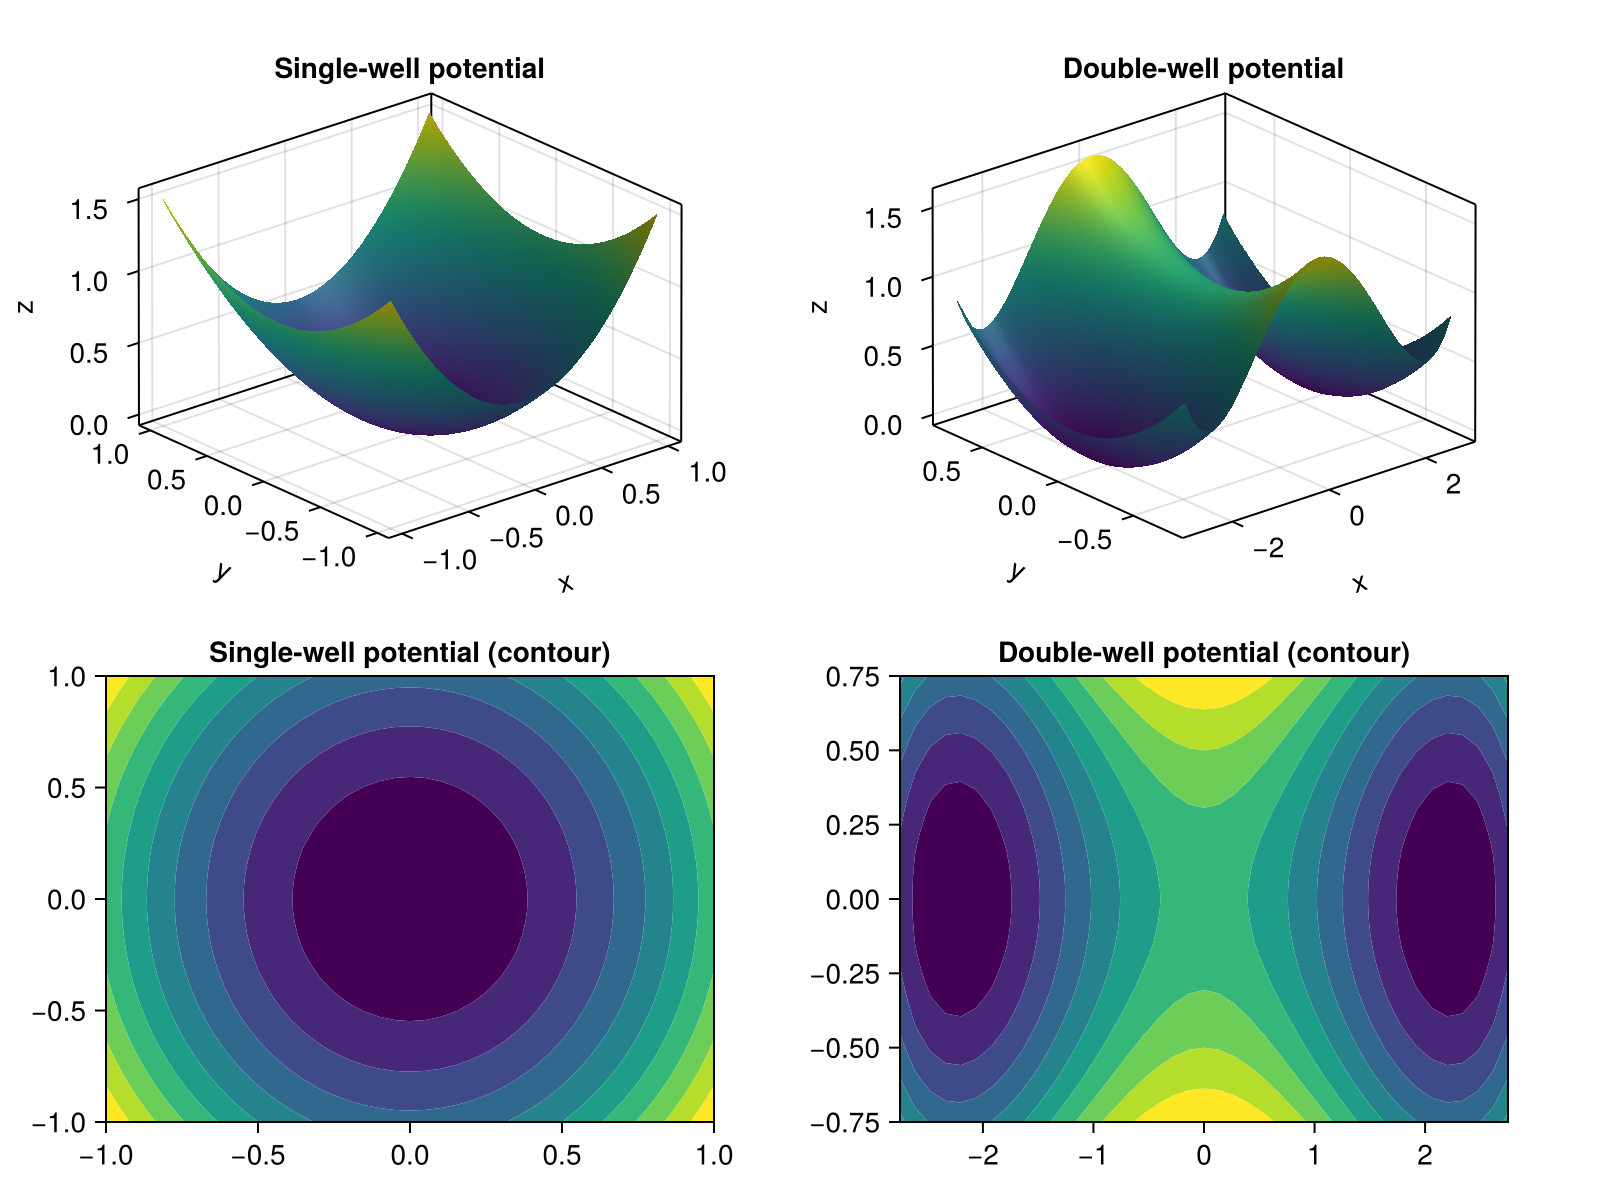
using CairoMakiez1(x, y) = x^2 + 0.5y^2
z2(x, y) = (.2x^2-1)^2 + y^2
x1 = y1 = range(-1.0, 1.0, 41)
x2 = range(-2.75, 2.75, 41)
y2 = range(-0.75, 0.75, 41)
zz1 = [z1(x, y) for x in x1, y in y1]
zz2 = [z2(x, y) for x in x2, y in y2];fig = Figure(resolution = (800, 600))
ax1 = Axis3(fig[1, 1], title="Single-well potential")
surface!(ax1, x1, y1, zz1, colormap = :viridis)
ax2 = Axis(fig[2, 1], title="Single-well potential (contour)")
contourf!(ax2, x1, y1, zz1, colormap = :viridis)
ax3 = Axis3(fig[1, 2], title="Double-well potential")
surface!(ax3, x2, y2, zz2, colormap = :viridis)
ax4 = Axis(fig[2, 2], title="Double-well potential (contour)")
contourf!(ax4, x2, y2, zz2, colormap = :viridis)
fig┌ Warning: Found `resolution` in the theme when creating a `Scene`. The `resolution` keyword for `Scene`s and `Figure`s has been deprecated. Use `Figure(; size = ...` or `Scene(; size = ...)` instead, which better reflects that this is a unitless size and not a pixel resolution. The key could also come from `set_theme!` calls or related theming functions.
└ @ Makie ~/.julia/packages/Makie/Vn16E/src/scenes.jl:264
This notebook was generated using Literate.jl.