model of quorum sensing mechanism of Vibrio fischeri
using OrdinaryDiffEq
using SteadyStateDiffEq
using ComponentArrays: ComponentArray
using SimpleUnPack
using CairoMakie
function model725!(D, u, p, t; feedback=true)
hil(x, k) = x / (k + x)
hil(x, k, n) = hil(x^n, k^n)
@unpack k0, k1, k2, n, a, b, a0, KM, RT, diff, popsize = p
@unpack A, I, Rstar, Aout = u
R0 = RT - 2Rstar
v0 = k0 * ifelse(feedback, I, 15.0)
v1 = k1 * A^2 * R0^2
v2 = k2 * Rstar
va = n * (A - Aout)
D.A = v0 - 2v1 + 2v2 - va
D.I = a0 + a * hil(Rstar, KM) - b * I
D.Rstar = v1 - v2
D.Aout = popsize * va - diff * Aout
nothing
end
function model725_nofeed!(D, u, p, t)
model725!(D, u, p, t; feedback=false)
endmodel725_nofeed! (generic function with 1 method)ps725 = ComponentArray(
k1=0.5, # /muM^3 /min
k2=0.02, # /min
b=0.07, # /min
KM=0.01, # muM
a=10, # muM/min
diff=1000,
popsize=1000,
RT=0.5,
k0=0.0008,
n=0.6,
a0=0.05
)
ics725 = ComponentArray(
A=0.0,
I=0.0,
Rstar=0.0,
Aout=0.0,
)
prob725 = SteadyStateProblem(model725!, ics725, ps725)
prob725_nofeed = SteadyStateProblem(model725_nofeed!, ics725, ps725)
npops = 1:5000
trajectories = length(npops)
alg = DynamicSS(KenCarp47())
prob_func = (prob, i, repeat) -> remake(prob, p=ComponentArray(ps725; popsize=npops[i]))
eprob = EnsembleProblem(prob725; prob_func)
eprob_nofeed = EnsembleProblem(prob725_nofeed; prob_func)
@time sim = solve(eprob, alg; trajectories);
@time sim_nofeed = solve(eprob_nofeed, alg; trajectories); 5.809786 seconds (122.99 M allocations: 3.443 GiB, 14.64% gc time, 109.63% compilation time: <1% of which was recompilation)
2.793595 seconds (82.07 M allocations: 2.095 GiB, 10.29% gc time, 86.22% compilation time)
luxI = map(s -> s.u.I, sim)
luxI_nofeed = map(s -> s.u.I, sim_nofeed)

fig = Figure()
ax = Axis(fig[1, 1],
    xlabel="Population Size",
    ylabel="LuxI Concentration (μM)",
    title="Fig 7.25"
)
lines!(ax, npops, luxI, label="Original model")
lines!(ax, npops, luxI_nofeed, label="Without Feedback")
axislegend(ax, position=:rb)
fig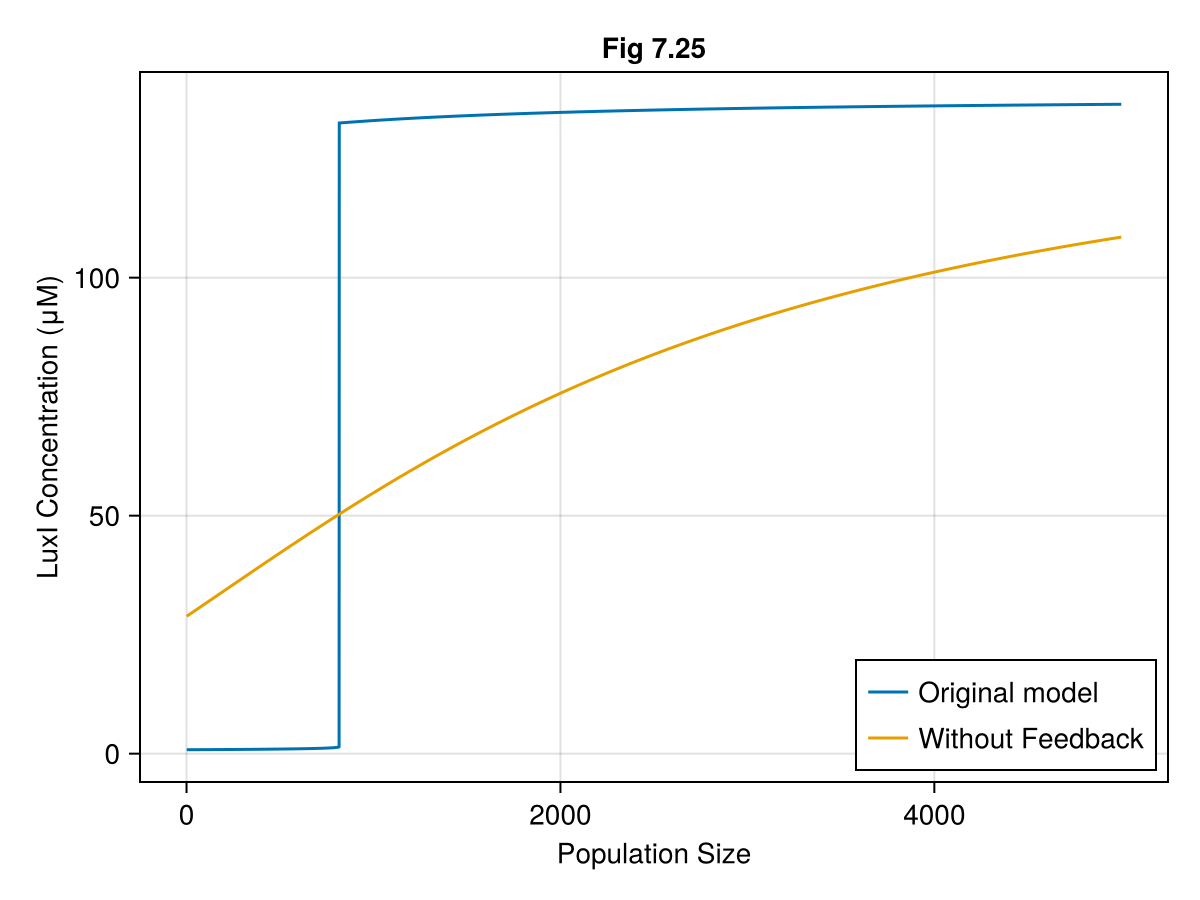
This notebook was generated using Literate.jl.