Methionine model
using ComponentArrays: ComponentArray
using OrdinaryDiffEq
using SimpleUnPack
using CairoMakie
function model510(u, p, t)
hil(x, k=one(x)) = x / (x + k)
hil(x, k, n) = hil(x^n, k^n)
@unpack K_AHC, Adenosine, v_MATI_max, Met, K_MATI_m, K_MATI_i,
v_MATIII_max, K_MATIII_m2, v_GNMT_max, K_GNMT_m, K_GNMT_i,
v_MET_max, A_over_K_MET_m2, alpha_d = p
@unpack AdoMet, AdoHcy = u
Hcy = AdoHcy * K_AHC / Adenosine
v_MATI = v_MATI_max * hil(Met * hil(K_MATI_i, AdoMet), K_MATI_m)
K_MATIII_m1 = 20000 / (1 + 5.7 * hil(AdoMet, 600)^2)
v_MATIII = v_MATIII_max * hil(Met, K_MATIII_m1 * hil(K_MATIII_m2, Met))
v_GNMT = v_GNMT_max * hil(AdoMet, K_GNMT_m, 2.3) * hil(K_GNMT_i, AdoHcy)
K_MET_m1 = 10 + 2.5 * AdoHcy
v_MET = v_MET_max * hil(AdoMet, K_MET_m1) * hil(A_over_K_MET_m2)
v_D = alpha_d * Hcy
dAdoMet = (v_MATI + v_MATIII) - (v_GNMT + v_MET)
dAdoHcy = (v_GNMT + v_MET - v_D) * hil(Adenosine, K_AHC)
return (; dAdoMet, dAdoHcy)
end
function model510!(D, u, p, t)
res = model510(u, p, t)
D.AdoMet = res.dAdoMet
D.AdoHcy = res.dAdoHcy
return nothing
endmodel510! (generic function with 1 method)ps510 = ComponentArray(
K_AHC = 0.1,
Adenosine = 1.0,
v_MATI_max = 561.0,
Met = 48.5,
K_MATI_m = 41.0,
K_MATI_i = 50.0,
v_MATIII_max = 22870.0,
K_MATIII_m2 = 21.1,
v_GNMT_max = 10600.0,
K_GNMT_m = 4500.0,
K_GNMT_i = 20.0,
v_MET_max = 4544.0,
A_over_K_MET_m2 = 0.1,
alpha_d = 1333.0
)
ics510 = ComponentArray(AdoMet = 10.0, AdoHcy = 10.0)ComponentVector{Float64}(AdoMet = 10.0, AdoHcy = 10.0)Figure 5.10
tend = 5.0
prob510 = ODEProblem(model510!, ics510, (0.0, tend), ps510)
@time sol510 = solve(prob510, KenCarp47())
7.746220 seconds (23.09 M allocations: 1.116 GiB, 3.23% gc time, 99.98% compilation time)
retcode: Success
Interpolation: 3rd order Hermite
t: 13-element Vector{Float64}:
 0.0
 0.005591346706322055
 0.023241496516159213
 0.04687904066903595
 0.08557265098327044
 0.17019826664980275
 0.3518250989733631
 0.6463222263444155
 1.1255791167726354
 1.876979034980279
 3.078351326655418
 4.864168615743981
 5.0
u: 13-element Vector{ComponentArrays.ComponentVector{Float64, Vector{Float64}, Tuple{ComponentArrays.Axis{(AdoMet = 1, AdoHcy = 2)}}}}:
 ComponentVector{Float64}(AdoMet = 10.0, AdoHcy = 10.0)
 ComponentVector{Float64}(AdoMet = 11.916965967732319, AdoHcy = 5.513518103820986)
 ComponentVector{Float64}(AdoMet = 16.579960489420507, AdoHcy = 1.9721568652823327)
 ComponentVector{Float64}(AdoMet = 21.471406063549086, AdoHcy = 1.811237720228203)
 ComponentVector{Float64}(AdoMet = 28.112787861018077, AdoHcy = 1.9909163268721648)
 ComponentVector{Float64}(AdoMet = 39.268854668707775, AdoHcy = 2.207634838817877)
 ComponentVector{Float64}(AdoMet = 55.28494588525326, AdoHcy = 2.400251796335146)
 ComponentVector{Float64}(AdoMet = 70.93751635032964, AdoHcy = 2.522364322786073)
 ComponentVector{Float64}(AdoMet = 85.04671222594877, AdoHcy = 2.6019575618358814)
 ComponentVector{Float64}(AdoMet = 95.83123778786988, AdoHcy = 2.6504665800868548)
 ComponentVector{Float64}(AdoMet = 102.65275300019532, AdoHcy = 2.677135076520204)
 ComponentVector{Float64}(AdoMet = 105.55352728753026, AdoHcy = 2.6876998596224784)
 ComponentVector{Float64}(AdoMet = 105.64420033308323, AdoHcy = 2.688024871835227)
fig = Figure()
ax = Axis(fig[1, 1],
xlabel = "Time (hr)",
ylabel = "Concentration (μM)",
title = "Fig. 5.10\nTime series"
)
lines!(ax, 0..tend, t -> sol510(t).AdoMet, label = "AdoMet")
lines!(ax, 0..tend, t -> sol510(t).AdoHcy, label = "AdoHcy")
axislegend(ax, position = :rc)
fig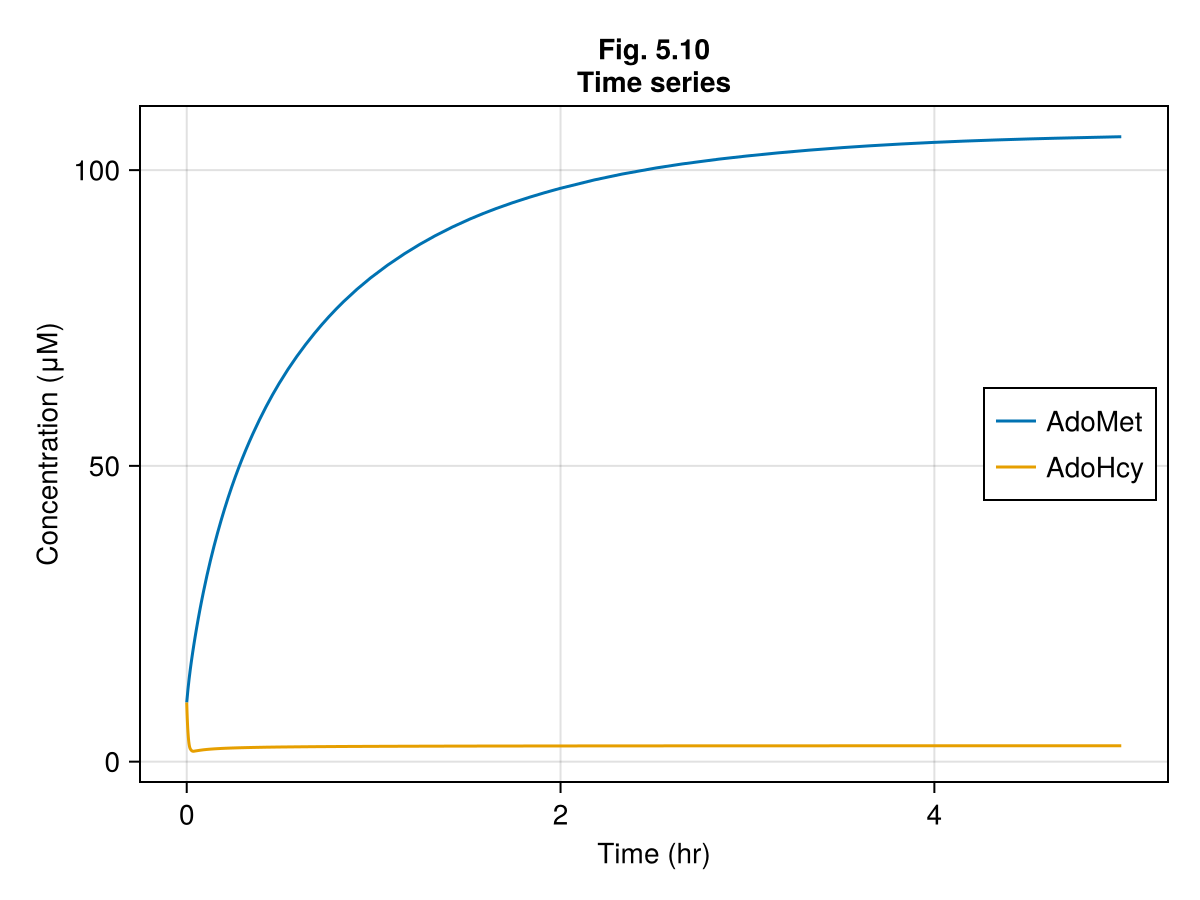
Figure 5.11 A
xx = range(0, 1200, 101)
yy = range(0, 6, 101)
∂A1 = [model510((;AdoMet=x, AdoHcy=y), ps510, nothing)[1] for x in xx, y in yy]
∂B1 = [model510((;AdoMet=x, AdoHcy=y), ps510, nothing)[2] for x in xx, y in yy]
∂F1 = function (x, y)
    da, db = model510((; AdoMet = x, AdoHcy = y), ps510, nothing)
    return Point2d(da, db)
end

fig = Figure()
ax = Axis(fig[1, 1],
    xlabel = "AdoMet (μM)",
    ylabel = "AdoHcy (μM)",
    title = "Fig. 5.11 A\nPhase plot"
)
streamplot!(ax, ∂F1, 0..1200, 0..6,)
contour!(ax, xx, yy, ∂A1, levels=[0], color=:black, label="AdoMet nullcline")
contour!(ax, xx, yy, ∂B1, levels=[0], color=:black, linestyle=:dash, label="AdoHcy nullcline")
axislegend(ax, position = :rb)
limits!(ax, 0, 1200, 0, 6)
fig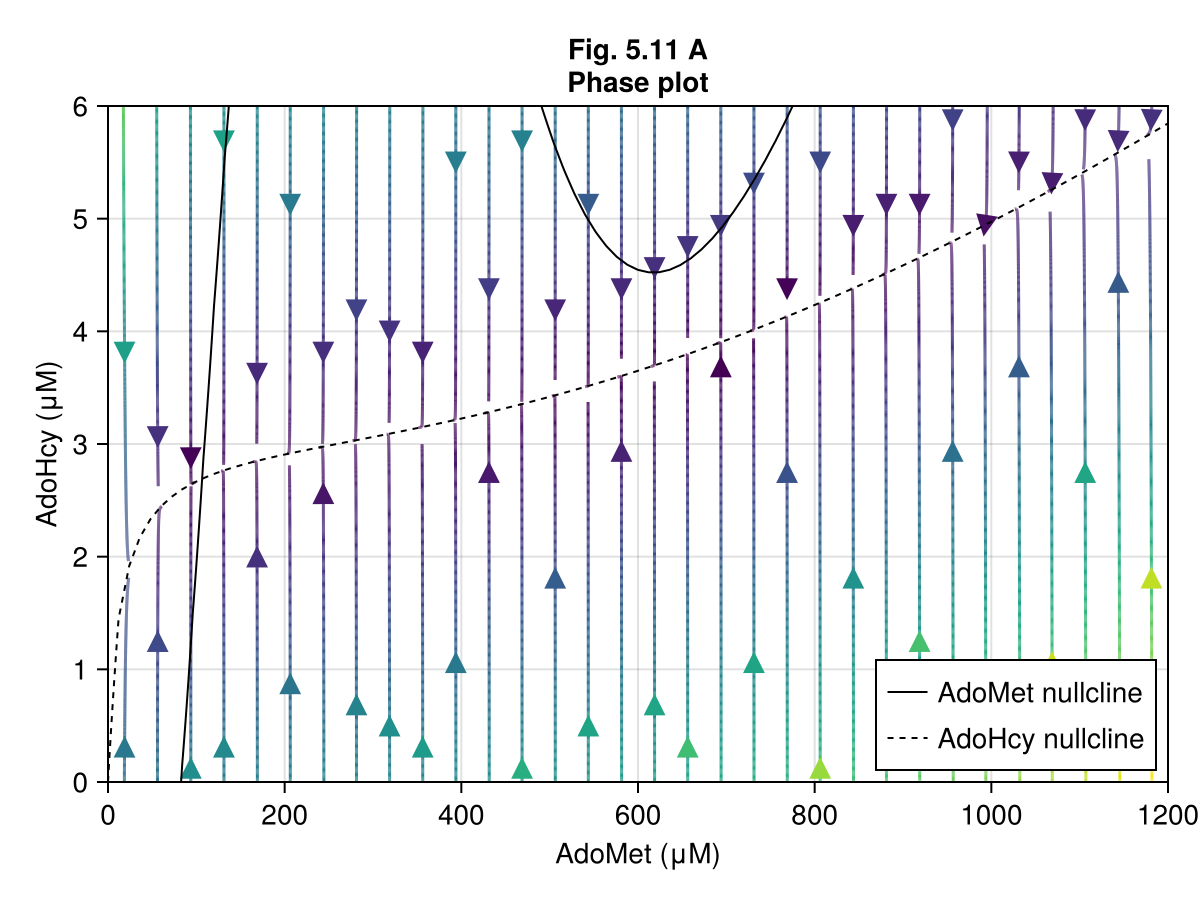
Figure 5.11 B
Increase methionine level
ps511b = ComponentArray(ps510; Met=51.0)
prob511b = remake(prob510, p=ps511b)

xx = range(0, 1200, 101)
yy = range(0, 6, 101)

∂A2 = [model510((; AdoMet=x, AdoHcy=y), ps511b, nothing)[1] for x in xx, y in yy]
∂B2 = [model510((; AdoMet=x, AdoHcy=y), ps511b, nothing)[2] for x in xx, y in yy]
∂F2 = function (x, y)
    da, db = model510((; AdoMet = x, AdoHcy = y), ps511b, nothing)
    return Point2d(da, db)
end

fig = Figure()
ax = Axis(fig[1, 1],
    xlabel = "AdoMet (μM)",
    ylabel = "AdoHcy (μM)",
    title = "Fig. 5.11 B\nIncreased methionine level",
)
streamplot!(ax, ∂F2, 0..1200, 0..6)
contour!(ax, xx, yy, ∂A2, levels=[0], color=:black, label="AdoMet nullcline")
contour!(ax, xx, yy, ∂B2, levels=[0], color=:black, linestyle=:dash, label="AdoHcy nullcline")
axislegend(ax, position = :rb)
limits!(ax, 0, 1200, 0, 6)
fig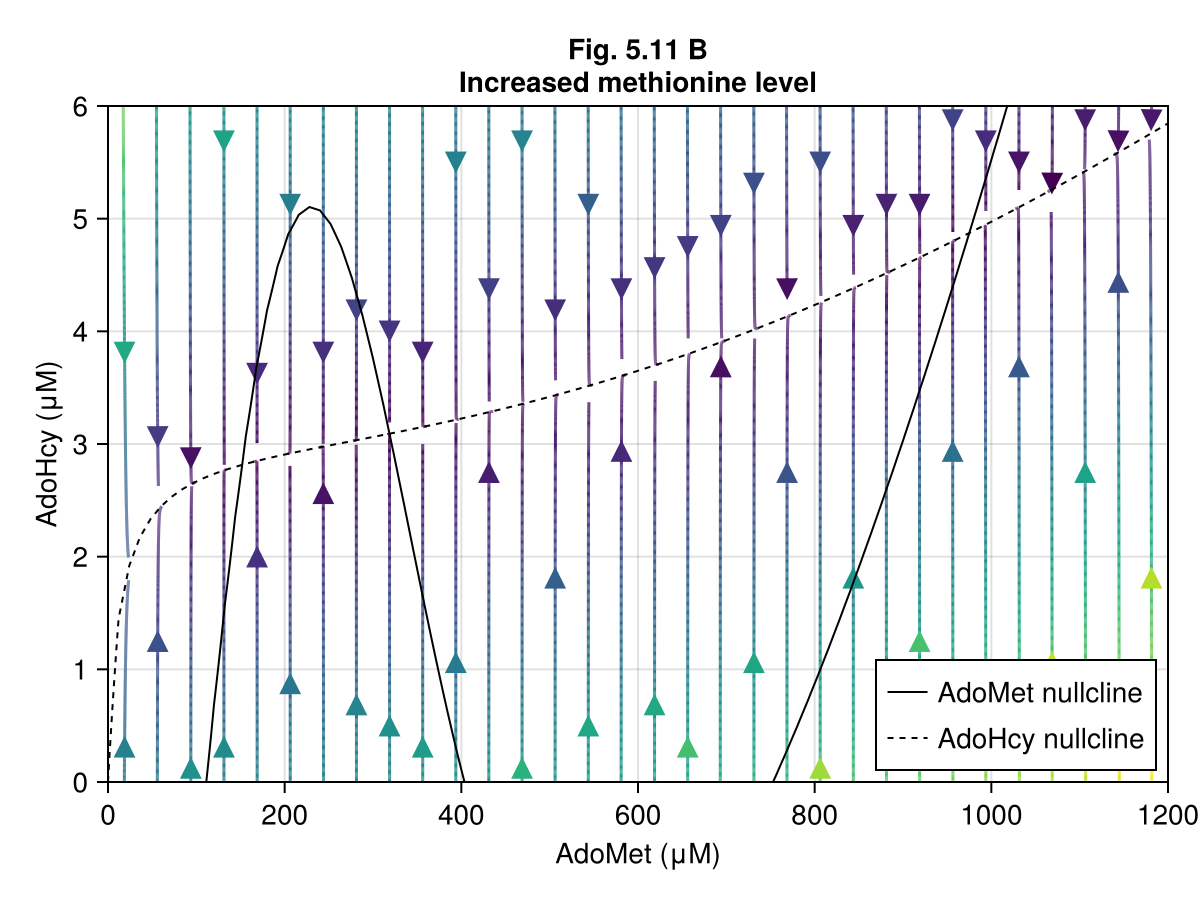
This notebook was generated using Literate.jl.